
Figure 5.
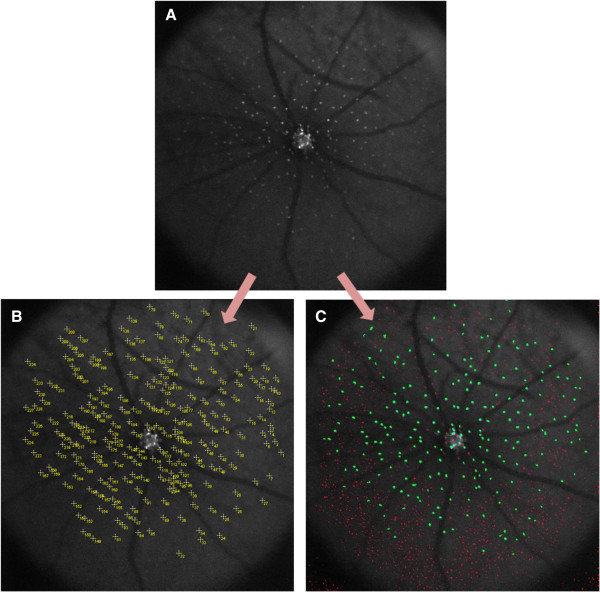
Example of a DARC image before and after undergoing manual and automated labeling. Image A represents a cropped DARC image before undergoing labeling. Image B represents the same DARC image after undergoing manual labeling using ImageJ® ‘multi-point selections’ tool, which marks and numbers each selected spot on the image. Image C represents the same DARC image after undergoing automated cell labeling using the novel Matlab® script. In Image C, structures identified as ‘cells’ have been labeled in green, whilst ‘non-cellular’ structures have been labeled in red.