
Figure 6.
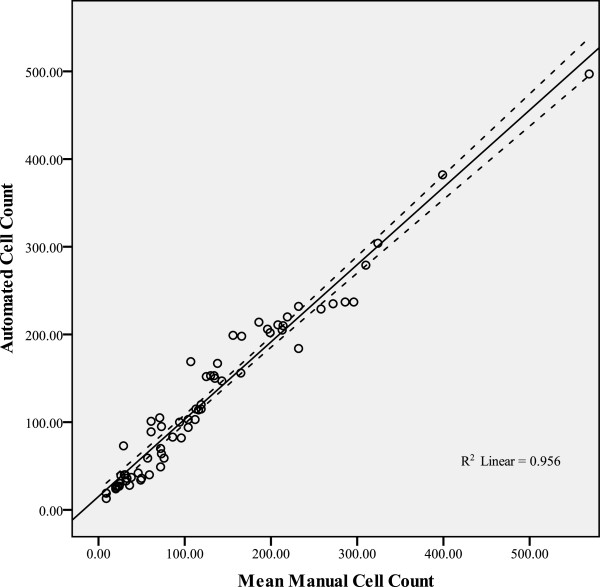
Correlation between the Mean Manual Cell Counts and the Automated Cell Counts of the 66 DARC images. The continuous line is the best-fit line, and the adjacent dotted lines represent the 95% confidence intervals.
Official websites use .gov
A
.gov website belongs to an official
government organization in the United States.
Secure .gov websites use HTTPS
A lock (
) or https:// means you've safely
connected to the .gov website. Share sensitive
information only on official, secure websites.
Correlation between the Mean Manual Cell Counts and the Automated Cell Counts of the 66 DARC images. The continuous line is the best-fit line, and the adjacent dotted lines represent the 95% confidence intervals.