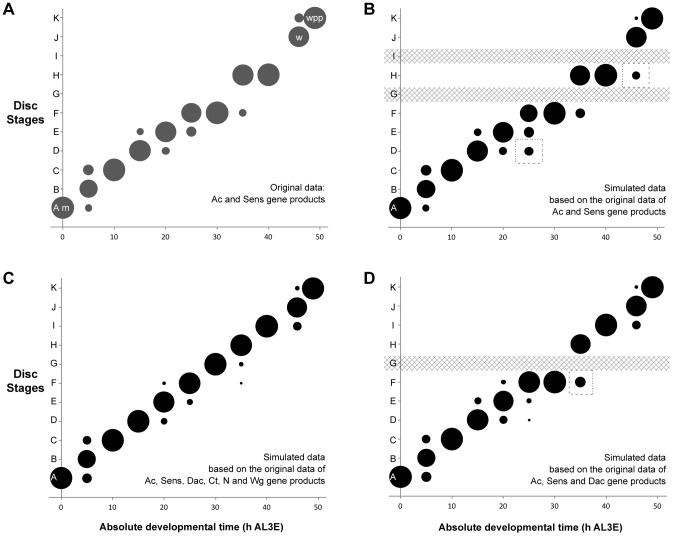
Figure 4. The probability of attributing a wing disc dissected at a given age to a particular disc stage.
(a) Proportion of discs attributed to each disc stage based on individual discs simultaneously staged for Ac and Sens. (b) By applying the Naïve Bayes Classifier (NBC) to the permuted data set based only on Ac and Sens expression patterns, our staging scheme was able to distinguish between discs from each time point and classify them into their appropriate stages. Dashed boxes highlight regions where the simulated data set showed greater variation than the actual data from a. (c) We repeated the NBC classifier analysis using the expression patterns of Ac, Sens, Dac, Ct, N and Wg. (d) Using the expression patterns of Ac, Sens and Dac to classify the discs, the results were nearly identical, except the NBC classified all discs at 30 h AL3E (stage G) as stage F. This is because stages G and F share the same Ac, Sens and Dac expression patterns. The dashed box marks a time point where the simulated data from Ac, Sens and Dac alone showed greater variation than the simulated data generated using the complete panel of six patterning gene products. Developmental events are identified by m (moult to the third instar), w (wandering) and wpp (white pre-pupae – pupariation).

