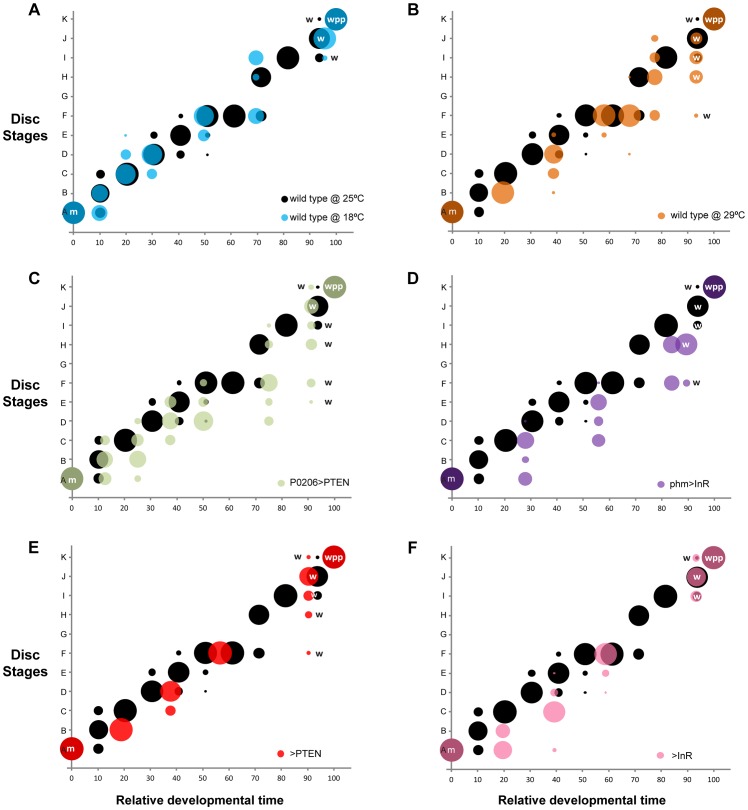
Figure 6. Changing developmental time alters the progression of pattern.
Probability (represented by the size of the circle) that a disc with a given set of gene-specific stages belongs to a particular disc stage, varying with relative developmental time (normalized to pupariation). In all panels (a-f), we show the wild type at 25°C in black. (a-b) Temperature manipulations: (a) disc stages attributed to discs from wild-type larvae reared at 18°C are shown in blue and (b) from wild-type larvae reared at 29°C are shown in orange. (c-d) Manipulations of the timing of ecdysis synthesis: (c) disc stages attributed to discs from P0206>PTEN larvae are shown in green and (d) disc stages attributed to discs from phm>InR larvae are in purple. (e-f) Parental lines to test for the contribution of genetic background: (e) disc stages attributed to discs from >PTEN larvae in red and (f) from >InR larvae in pink. Developmental events are identified by m (moult to the third instar), w (wandering) and wpp (white pre-pupae – pupariation).

