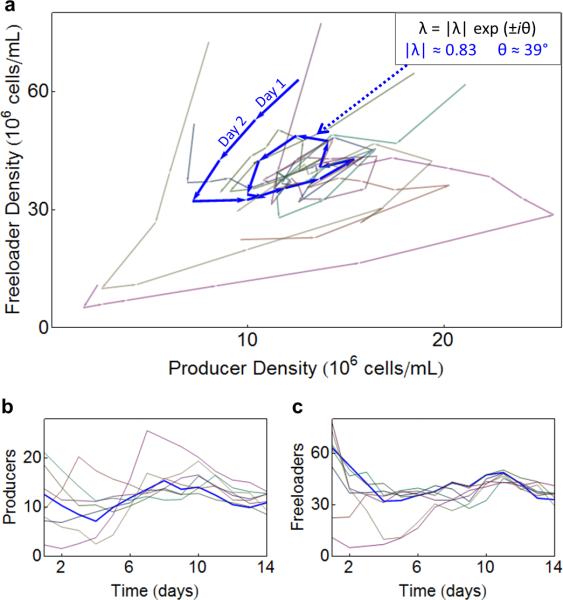
Figure 2. The coupled spiral dynamics of the producer-freeloader ecosystem can be characterized by complex eigenvalues.
(a) The dynamics of the population density can be visualized as trajectories in the producer-freeloader phase plane. Replicate populations were grown from 30 different starting densities with a daily dilution of 1333 for 14 days. Selected trajectories are colored consistently on the three plots, with remaining trajectories shown in light grey. The indicated blue trajectory has complex eigenvalues λ=0.83 e±i39°. The individual dynamics of the producers (b) and the freeloaders (c) are plotted as a function of time (both are expressed in units of 106 cells/mL)

