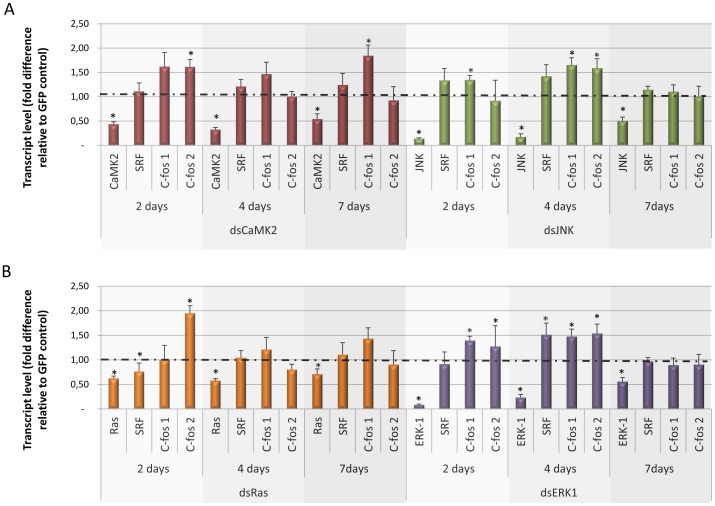
Figure 7. Transcript levels of SmSRF and Smc-fos1 and Smc-fos2 genes 2, 4, and 7 days after schistosomula were exposed to various MAPK dsRNAs.
Bar graph indicating the relative steady-state transcript levels of (A) SmCaMK2 (red), SmJNK (green) and (B) SmRas (orange), SmERK1(purple) genes after 2, 4, and 7 days of dsRNA exposure. For each dsRNA tested, data are represented as mean fold-differences (+/−SE) relative to GFP control (1.00). Transcript levels were determined by qPCR and data analyzed using the ΔΔCt method [24] followed by statistical analysis using the Mann-Whitney U-test. Data were generated from 3 independent experiments, each one in duplicate. Significance levels (*) were set at P≤0.05.

