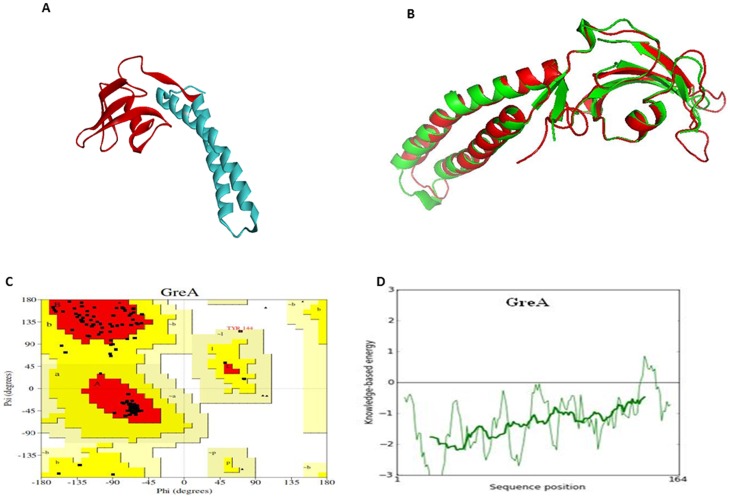
Figure 4. Prediction of 3D structural model and validation of Wol GreA.
(A) A computationally derived structural model of Wol GreA. The bioinformatics tool MODELLER9v10 was used to create a 3D ribbon model of Wol GreA that contained NTD (cyan) with RNA polymerase (RNAP) nucleolytic activity and CTD (red) possessing RNAP binding activity. (B) Structural superimposition of Wol GreA (red) with E. coli GreA (green) having PDB code1GRJ signifies an excellent template exhibiting 46% identity, 68% similarity, and 0.674 Å root mean square deviation (RMSD). (C) Ramachandran plot of Wol GreA constructed by PROCHECK revealed 89.8% a.a (red) residues of Wol GreA in most favored regions while 9.9% a.a (yellow) in additionally allowed regions and 0.3% a.a (pale yellow) in generously allowed regions, 0% a.a (white) residues were in disallowed regions. (D) Energy profile of Wol GreA was predicted by ProSA web server.

