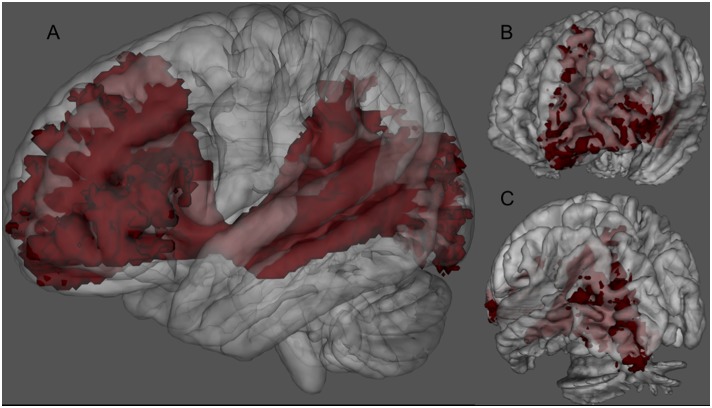
Figure 1. 3D rendering of the left IFOFq.
The left IFOFq, reconstructed on the 20 subjects and normalized to the MNI space, is visualized from a lateral (A), anterior (B) and posterior (C) point of view. In A the path of the whole bundle can be appreciated, whereas B and C show its group average cortical terminations. Voxels that were visited in the residual bootstrap tractography in at least 20% of subject are shown.

