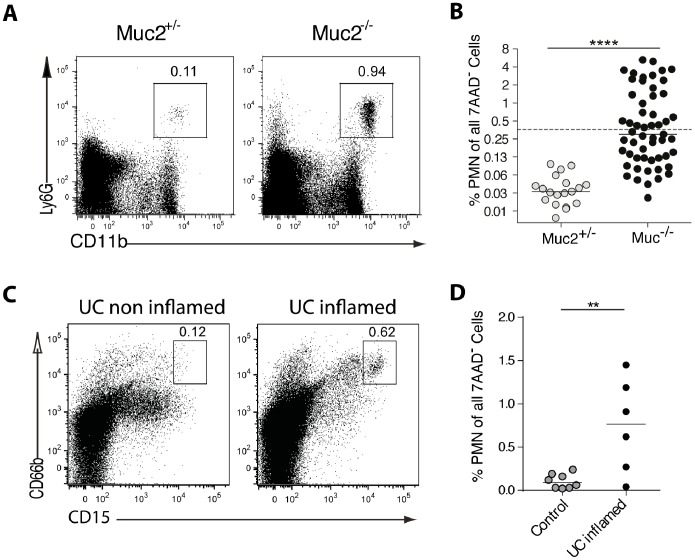
Figure 3. PMNs increase in the colon of Muc2−/− mice and UC patients.
Colon LP cells from Muc2−/− mice, Muc2+/− littermates, UC patients and non-inflamed controls were analyzed by flow cytometry. (A) PMNs in mice were identified as viable (7AAD−) MHCII−CD11b+Ly6G+ cells. The numbers represent the percent cells in the indicated gate. The Muc2−/− mouse shown did not have overt signs of inflammation such as rectal swelling. (B) The frequency of PMNs among viable LP cells for all mice examined is shown. The dashed line indicates the “cut off” value of 0.36% (see text for details). Results are from 17 independent experiments with a total of 19–55 mice per group. (C) PMNs in human tissue were identified as 7AAD−MHCII−CD15hiCD66b+ cells. The numbers represent the percent cells in the indicated gate. PMN gating was performed using a non-inflamed and inflamed sample from different colon regions from the same UC patient as negative and positive control. (D) The frequency of PMNs among viable LP cells for non-inflamed controls and UC patients with established disease is shown. Statistical significance was assessed using the Mann-Whitney-U-Test; significance is indicated as **p<0.01, ****p<0.0001. Each symbol represents an individual mouse or patient. The mice used were between 8–19 weeks of age.

