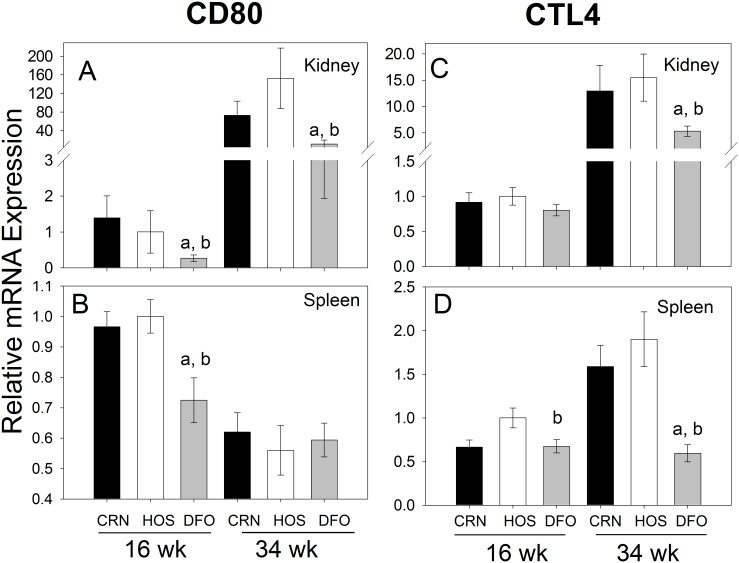
Figure 7. Differential effects of n-3, n-6 and n-9 PUFA consumption on CD80 and CTLA4 mRNA expression.
Cohorts of 4/J mice were fed diets enriched in n-3 (DFO), n-6 (CRN) or n-9 (HOS) for 30 wk. At wk 16 (pre-nephritis) and wk 34 (post-nephritis), mRNA was isolated from (A, C) kidneys and (B, D) spleens and analyzed for gene expression of CD80 (A, B) and CTLA4 (C, D) by real-time PCR. Data are expressed as mean ±SEM (n = 8). Letters a and b denote significant differences (p<0.05) from CRN- and HOS-fed mice, respectively.

