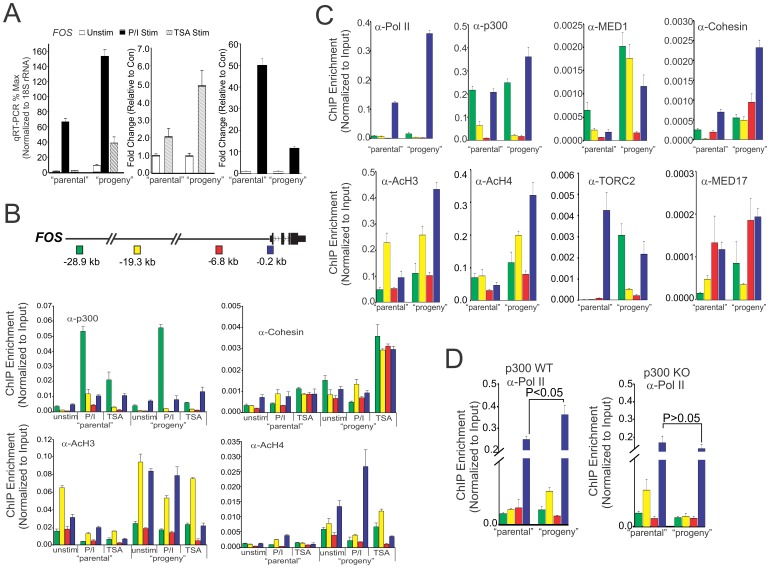
Figure 1. p300 facilitates parental trans-generational transmission of remembered states of potentiated transcriptional function.
(A) Jurkat cells were treated with PMA and Ionomycin (P/I) for 1 h “parental”. Cells were then washed and allowed to rest for 40 h. qRT-PCR profile showing FOS expression in resting Jurkat cells (“parental”) or Jurkat cells pre-treated with P/I (mitogen pulsed) for 1 h, washed, allowed to rest for 40 h (“progeny”) and restimulated with P/I (1 h) and TSA (2 h). The fold induction upon TSA stimulation (middle) or P/I stimulation (right) are presented as relative level compared to the amount present in the unstimulated population. (B) Position dependent profile of p300, Cohesin, acetylated histone H3 (AcH3) and acetylated histone H4 (AcH4) at the FOS locus of Jurkat cells as determined by quantitative ChIP analysis. Error bars represent standard error of the mean from 2 biological replicates each determined in duplicate. Shown above is a schematic of the locations of enhancers (−28.9 kb & −19.3 kb), upstream (−6.8 kb) and promoter (−0.2 kb) at the FOS locus relative to TSS. (C) Position dependent profile at the FOS locus of Jurkat cells, relative to TSS, for indicated factors as determined by quantitative ChIP analysis. Error bars represent standard error of the mean from 2 biological replicates each determined in duplicate. (D) Position dependent profiles of pol II at the FOS locus in p300 WT and p300 KO in HCT 116 cells. Error bars represent standard error of the mean from 2 biological replicates, each determined in duplicate.

