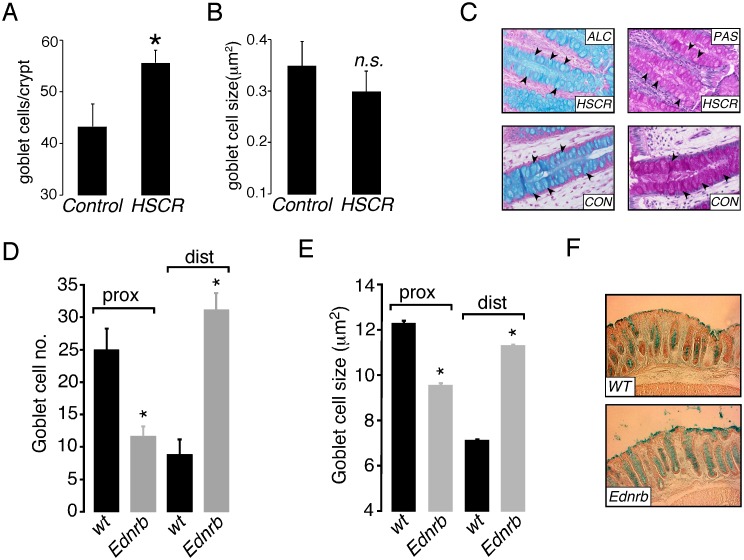
Figure 2. Colon goblet cells in human HSCR and Ednrb−/− mice.
A. Summary graph showing goblet cell density in colonic crypts from control (n = 4) and HSCR patients (n = 13). B. Summary graph showing goblet cell size (µm2) in colonic crypts from control (n = 4) and HSCR patients (n = 13). C. Representative images showing Periodic Acid Schiff (PAS) and Alcian blue (ALC) staining of colonic crypts from biopsies obtained from control (CON) and HSCR patients. D. Summary graph showing goblet cell density in colonic crypts from proximal (prox) and distal (dist) colon from WT (n = 5) and Ednrb−/− mice (n = 5). E. Summary graph showing goblet cell size (µm2) in colonic crypts from WT (n = 5) and Ednrb−/− mice (n = 5). F. Representative images showing Alcian blue staining of goblet cells from distal colon from WT and Ednrb−/− mice. *p<0.05, n.s. = not significant.

