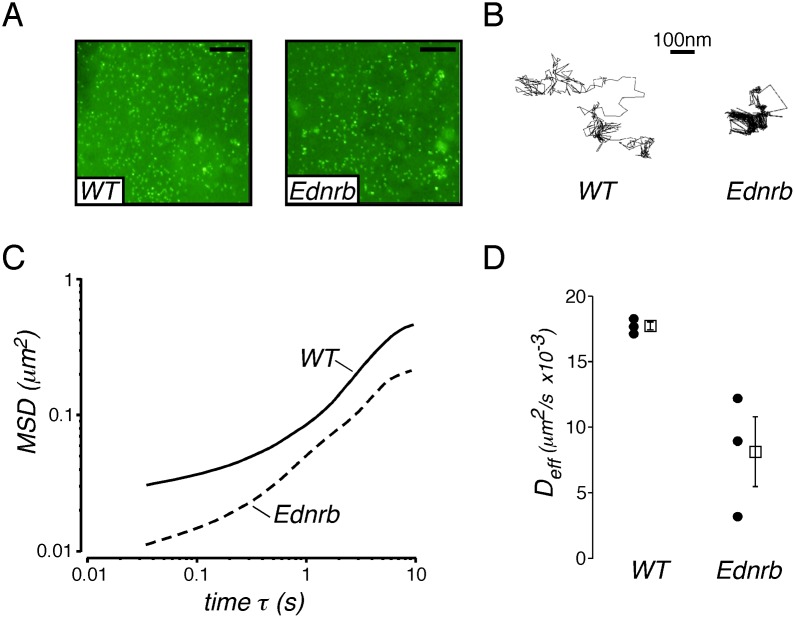
Figure 5. Transport of microspheres in mucus on explanted Ednrb−/− and WT mouse colon.
A. Images from WT and Ednrb−/− surface mucus showing equilibration of 200 nm fluorescent particles throughout the mucus layer. B. Representative 20-second trajectories of particles in WT and Ednrb−/− mucus. C. Ensemble averaged mean-squared displacement (MSD) for carboxylate-modified particles in WT and Ednrb−/− mucus as a function of time. D. Ensemble effective diffusion coefficients of particles at a time scale of 10 seconds in WT and Ednrb−/− mice. Black dots represent individual experimental averaged runs, and open squares represent the mean ± SEM. Scale bar = 20 µm (A).

