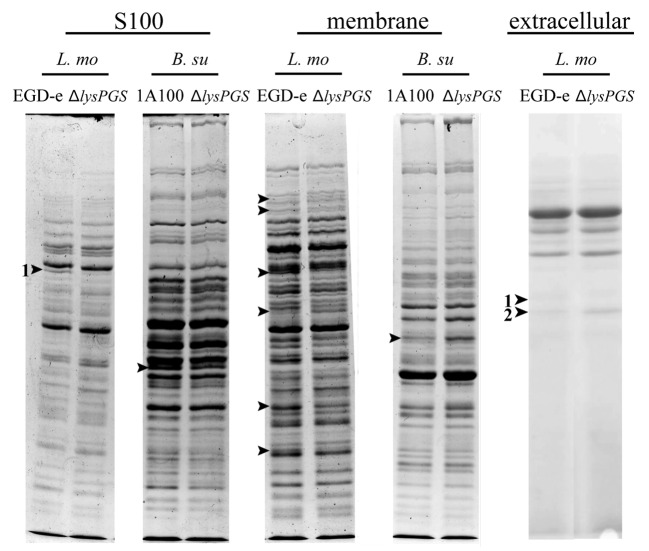
Figure 6. Changes in protein localization correlated with LysPG loss in B. subtilis and L. monocytogenes. Arrows indicate bands that were sent for identification by mass spectrometry and numbers indicate positive identifications in comparison to the appropriate control. Strains are abbreviated as follows: L. mo, L. monocytogenes; EGD-e, L. monocytogenes EGD-e; ΔlysPGS, L. monocytogenes EGD-e ΔlysPGS; B. su, B. subtilis; 1A100, B. subtilis 1A100; ΔlysPGS, B. subtilis 1A100 ΔlysPGS. Numbered excised bands were subsequently analyzed as shown in Table 2 (S100 band 1) and Table 3 (extracellular bands 1 and 2).

An official website of the United States government
Here's how you know
Official websites use .gov
A
.gov website belongs to an official
government organization in the United States.
Secure .gov websites use HTTPS
A lock (
) or https:// means you've safely
connected to the .gov website. Share sensitive
information only on official, secure websites.
