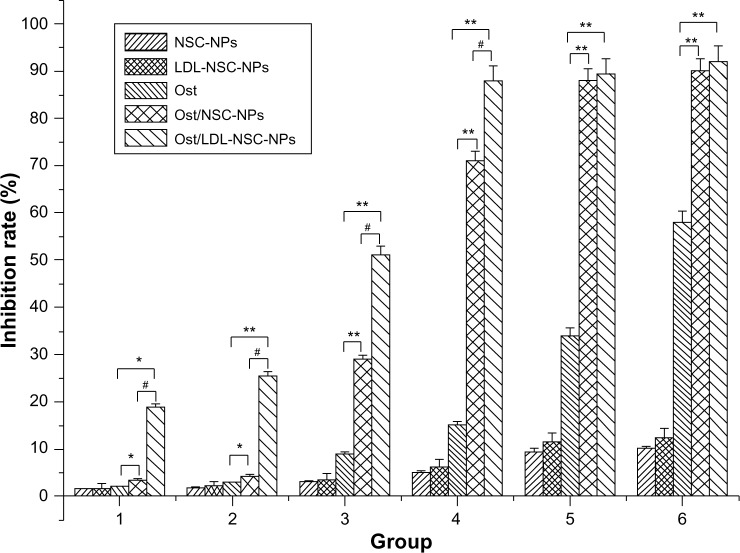
Figure 6.
Cytotoxic effects of various formulations against HepG2 in vitro.
Notes: Ost concentration (μg·mL−1)/NSC concentration (μg·mL−1): (1) 10/50, (2) 20/100, (3) 40/200, (4) 80/400, (5) 160/800, and (6) 320/1600; *represents P<0.05 versus Ost group; **represents P<0.01 versus Ost group; #represents P<0.01 versus Ost/NSC-NPs group; n=3.
Abbreviations: LDL, low-density lipoprotein; NPs, nanoparticles; NSC, N-succinyl-chitosan; Ost, osthole.

