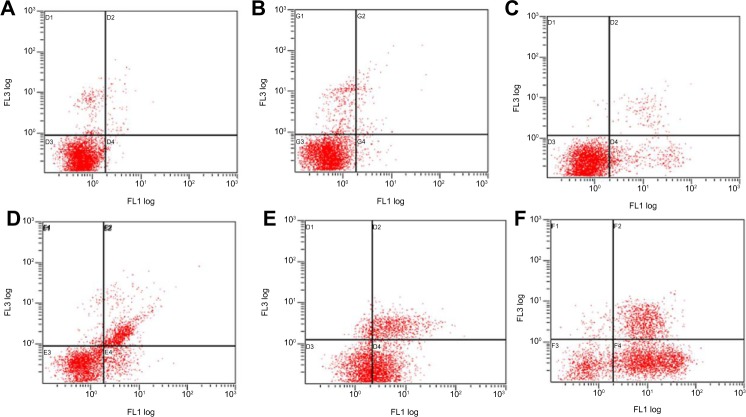
Figure 8.
Apoptosis was also verified through flow cytometry.
Notes: HepG2 cells were treated with (A) negative control, (B) NSC-NPs, (C) LDL-NSC-NPs, (D) 100 μg·mL−1 Ost, (E) 100 μg·mL−1 Ost/NSC-NPs, and (F) 100 μg·mL−1 Ost/LDL-NSC-NPs, and then stained with Annexin V–FITC and PI. Flow cytometry profile shows Annexin V–FITC staining on the x-axis and PI on the y-axis.
Abbreviations: FITC, fluorescein isothiocyanate; LDL, low-density lipoprotein; NPs, nanoparticles; NSC, N-succinyl-chitosan; Ost, osthole; PI, propidium iodide; FL, fluorescence.

