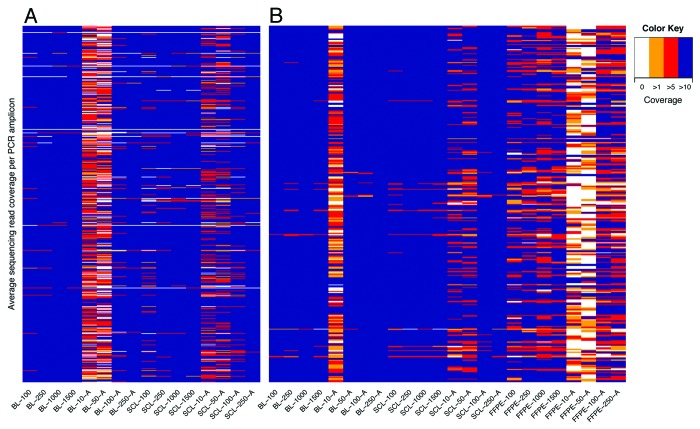
Figure 2. Average per-base sequencing read coverage across PCR amplicons. The heatmaps show the average per-base read coverage across the ~500 PCR amplicons using the (A) BM primer panel and (B) SC panel. The color scheme indicates different levels of read coverage, i.e., 0, 1, 5 and 10. PCR amplicons were mostly covered with at least five sequencing reads across all samples other than those with a starting DNA material of 10 and 50 ng.

An official website of the United States government
Here's how you know
Official websites use .gov
A
.gov website belongs to an official
government organization in the United States.
Secure .gov websites use HTTPS
A lock (
) or https:// means you've safely
connected to the .gov website. Share sensitive
information only on official, secure websites.
