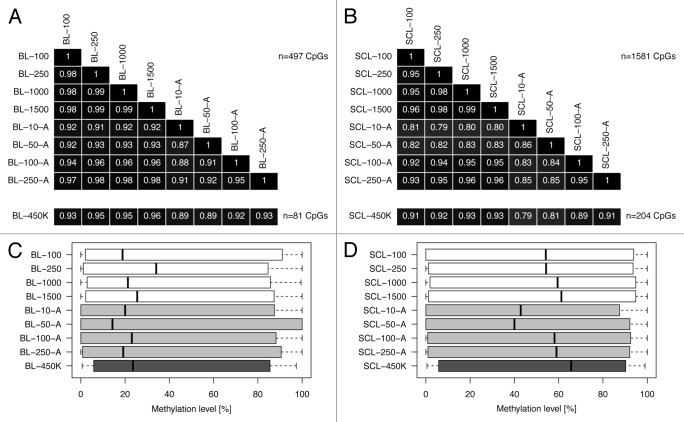
Figure 4. Correlation of DNA methylation levels and comparison to 450K arrays. The heatmaps show matrices of Pearson’s correlation coefficients across (A) BL samples (n = 497 CpG sites) and (B) SCL samples (n = 1581 CpG sites), assessed using the BM panel. The DNA methylation levels of unamplified samples with a starting DNA amount between 100 ng and 1500 ng were strongly correlated (median R = 0.98). Further, we correlated a subset of these CpG sites, i.e., n = 81 and n = 204 CpGs across BL and SCL samples, that are represented on the 450K array. We found a strong correlation (R ≥ 0.91) for unamplified samples and a moderate correlation (R ≥ 0.79) for WGA samples. Panels (C) and (D) show the distribution of DNA methylation scores at the assessed CpG sites.

An official website of the United States government
Here's how you know
Official websites use .gov
A
.gov website belongs to an official
government organization in the United States.
Secure .gov websites use HTTPS
A lock (
) or https:// means you've safely
connected to the .gov website. Share sensitive
information only on official, secure websites.
