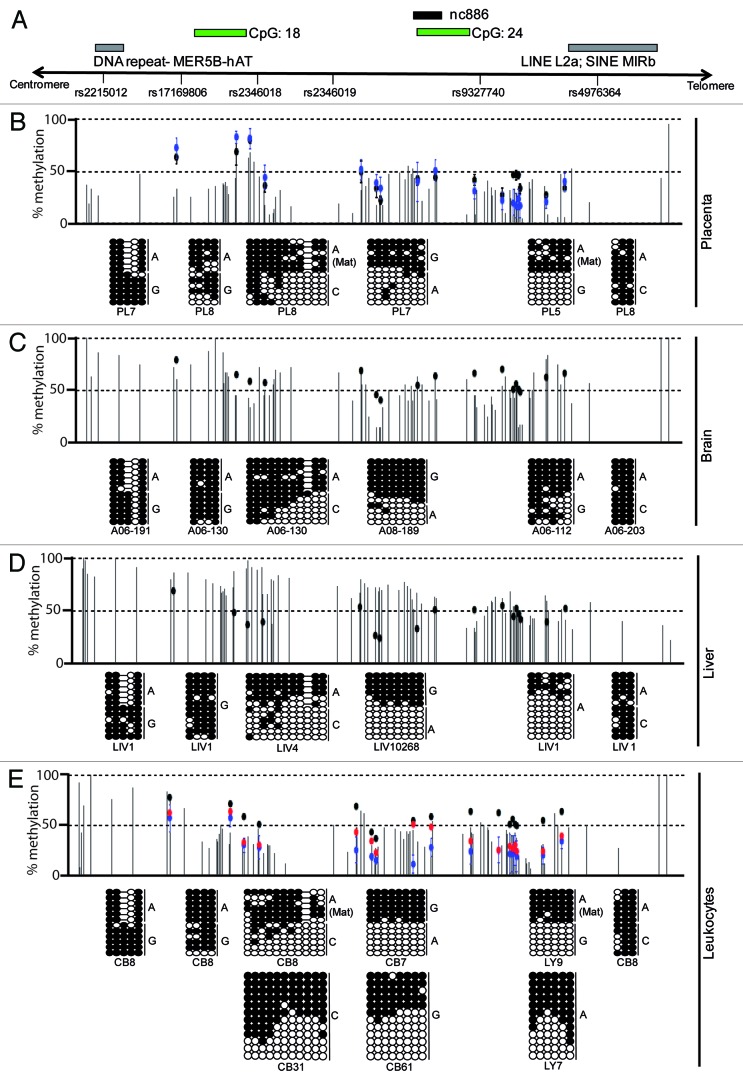
Figure 1. Mapping the extent of allelic methylation at the nc886 interval in 4 human tissues. (A) Map of the nc886 locus, showing the location of the transcript, CpG islands, genetic variants and DNA repeat-elements. (B) Detailed methylation map of the nc886 interval for placenta as determined by WGBS and Infinium HumanMethylation BeadChip array. Vertical dark gray lines in the WGBS tracks represent the methylation value for individual CpG dinucleotides and each dot representing the methylation of a single array probe: normal placenta (black dots) and hydatidiform mole (blue dots). The pattern of methylation was confirmed using bisulphite PCR in heterozygous samples so that allelic origin could be ascertained. Each circle represents a single CpG dinucleotide on a DNA strand, a methylated cytosine (⚫) or an unmethylated cytosine (○). The methylation profiles for brain (C), liver (D) and leukocytes (E) also reveal partial methylation over the nc886 transcript. The lower panel also shows the DNA methylation profile for normal leukocytes (black), genome-wide pUPD (blue) and mUPD (red) samples as determined by the Infinium methylation array.

An official website of the United States government
Here's how you know
Official websites use .gov
A
.gov website belongs to an official
government organization in the United States.
Secure .gov websites use HTTPS
A lock (
) or https:// means you've safely
connected to the .gov website. Share sensitive
information only on official, secure websites.
