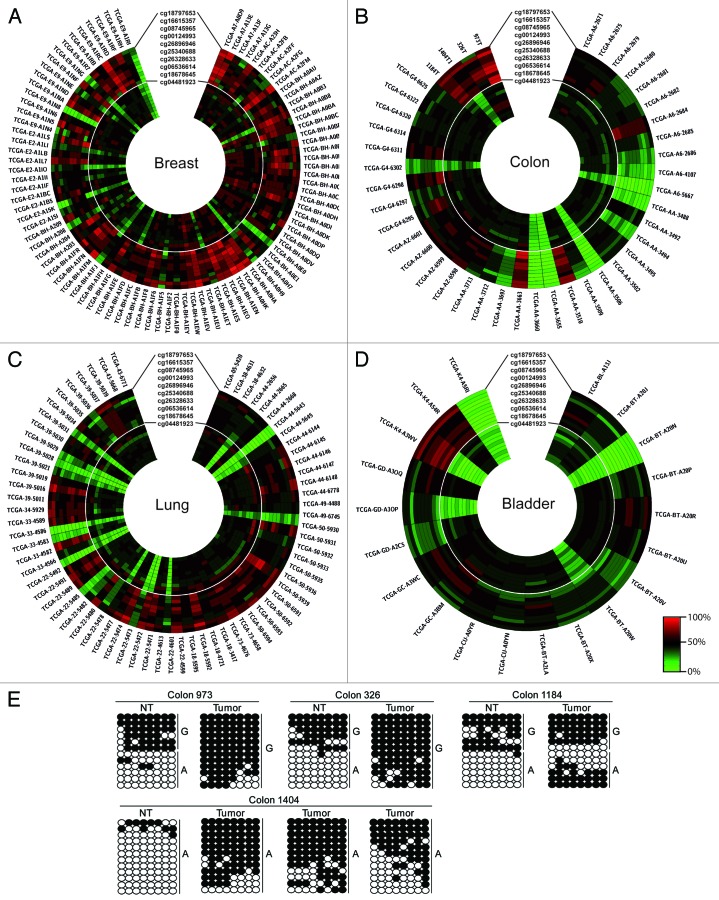
Figure 4. Profiling the methylation status of the nc886 locus in human tumor samples. Circular heat map of Infinium array probes mapping to the nc886 locus in (A) breast, (B) colorectal, (C) lung and (D) bladder tumors. In each case the inner circle represents the methylation values of the normal tissue and the outer circle the corresponding tumor. (E) Confirmation of the methylation profile overlapping the rs2346019 interval in various CRC samples sets. Each circle represents a single CpG dinucleotide on a DNA strand, a methylated cytosine (⚫) or an unmethylated cytosine (○).

An official website of the United States government
Here's how you know
Official websites use .gov
A
.gov website belongs to an official
government organization in the United States.
Secure .gov websites use HTTPS
A lock (
) or https:// means you've safely
connected to the .gov website. Share sensitive
information only on official, secure websites.
