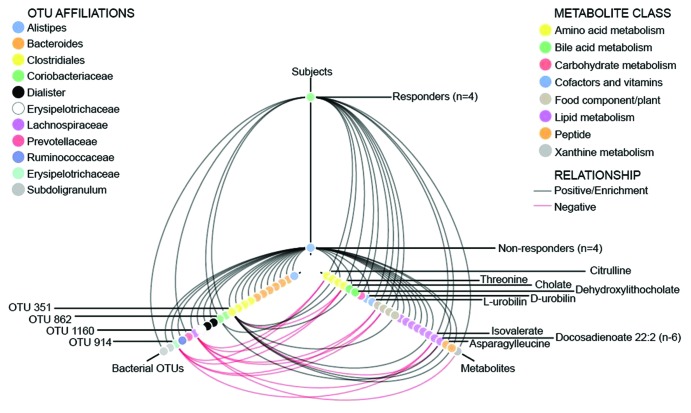
Figure 5. Hive plot showing tripartite associations among microbial taxa, metabolites, and clinical response following a low fermentable substrate dietary intervention. Responders were defined as those with a ≥50% decrease in abdominal pain frequency during the intervention. Red lines indicate a negative correlation (OTU vs. metabolite) or relative depletion (OTU or metabolite vs. subjects), while black lines indicate positive correlations or enrichment. OTUs and metabolites are color coded by taxonomic affiliation or metabolite class, and OTUs and metabolites of specific interest are highlighted with labels. Positive correlations are shown with respect to subject correlations though the inverse (negative correlation) is present in the other subject group (responders vs. non-responders).

An official website of the United States government
Here's how you know
Official websites use .gov
A
.gov website belongs to an official
government organization in the United States.
Secure .gov websites use HTTPS
A lock (
) or https:// means you've safely
connected to the .gov website. Share sensitive
information only on official, secure websites.
