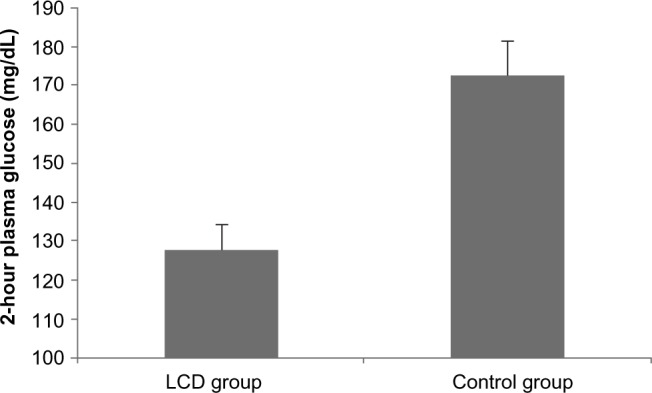
Figure 1.

Plasma glucose at 2 hours after an oral glucose load (12-month endpoint).
Notes: y-axis shows 2-hour plasma glucose (mg/dL); data are shown as the mean ± standard error for each group.
Abbreviation: LCD, low-carbohydrate diet.

Plasma glucose at 2 hours after an oral glucose load (12-month endpoint).
Notes: y-axis shows 2-hour plasma glucose (mg/dL); data are shown as the mean ± standard error for each group.
Abbreviation: LCD, low-carbohydrate diet.