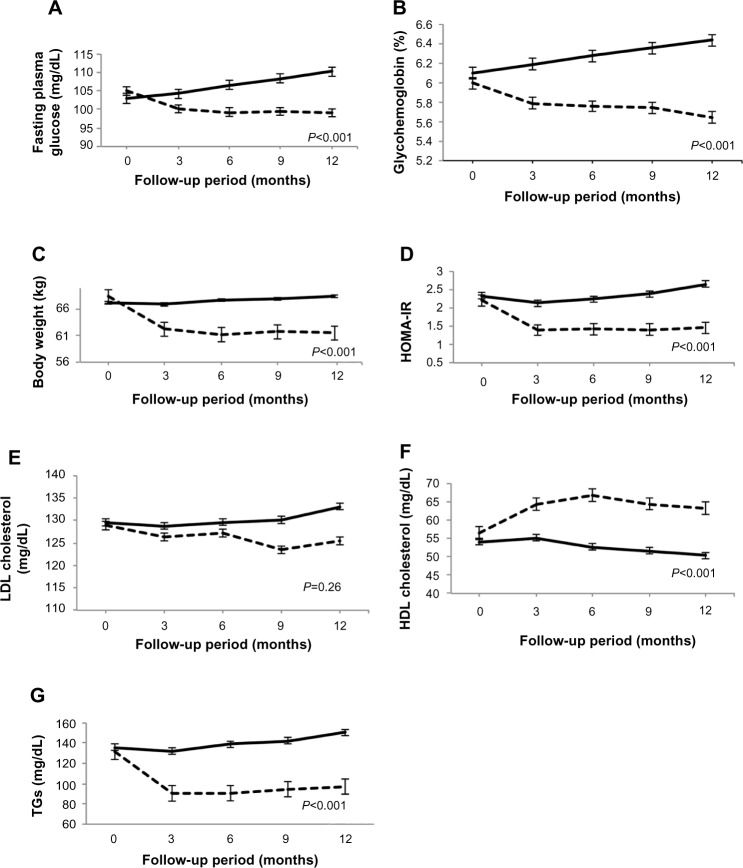
Figure 2.
(A) Profile of fasting plasma glucose; (B) glycohemoglobin; (C) body weight; (D) HOMA-IR; (E) LDL cholesterol; (F) HDL cholesterol; and (G) TGs in each group.
Notes: Data points represent the mean ± standard error for each group at the indicated times. The dashed lines and the solid lines represent the LCD group and the control group, respectively. ------- LCD group, —— control group. The HOMA-IR was calculated as fasting insulin (μU/mL) × fasting glucose (mg/dL) ÷ 405.
Abbreviations: HDL, high-density lipoprotein; HOMA-IR, homeostasis model of assessment of insulin resistance; LCD, low-carbohydrate diet; LDL, low-density lipoprotein; TGs, triglycerides.

