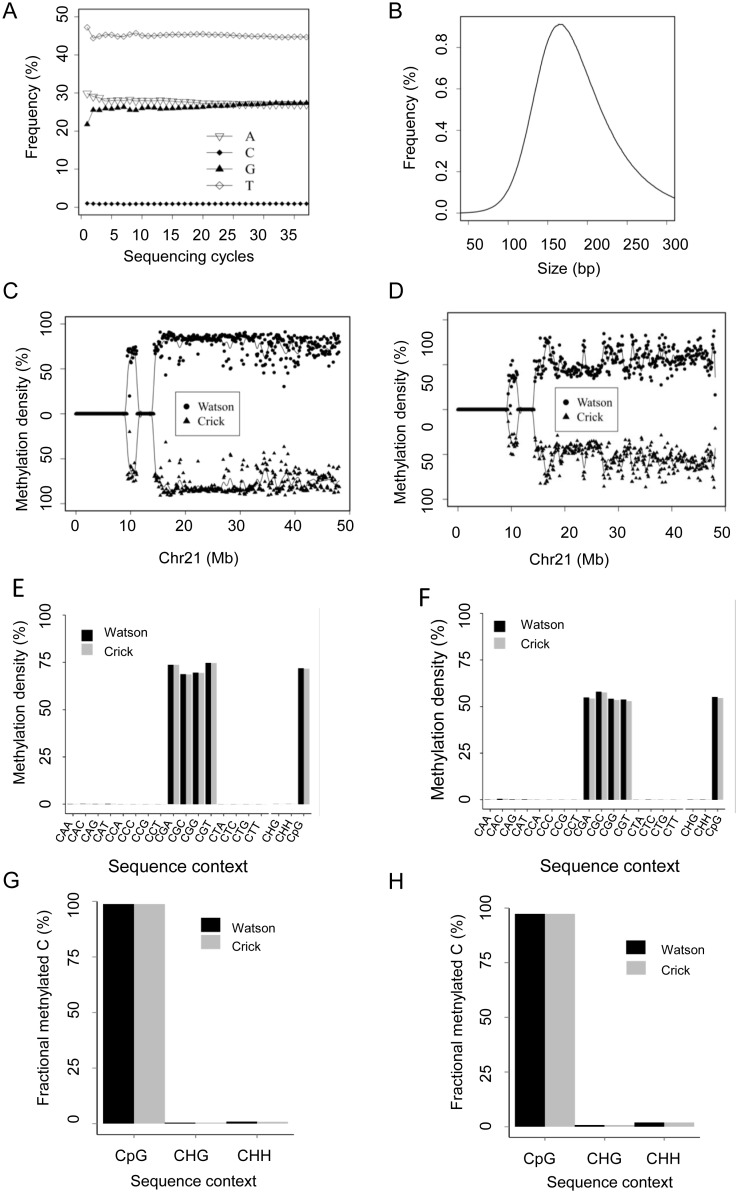
Figure 5. Summary of Methy-Pipe results from BSAnalyzer module.
(A) The plot of the base (A, C, G, T) frequency at each sequencing cycle. X-axis indicates the sequencing cycle. Y-axis indicates the base frequency. (B) The length distribution of the insert size of a paired-end bisulfite sequencing library. X-axis represents the insert size. Y-axis represents the percentage of insert with the indicated size. (C, D) Whole genome methylation profiling with fixed window approach for buffy coat sample (C) and placenta sample (D). Dots on the top are for the Watson strand and triangles on the bottom are for the Crick strand. (E, F) Whole genome methylation profiling within different sequence contexts. MDs at different sequence contexts, namely CAA, CAC, CAG, CAT, CCA, CCC, CCG, CCT, CGA, CGC, CGG, CGT, CTA, CTC, CTG, CTT, are calculated for buffy coat (E) and placenta (F), respectively. (G, H). The fractions of the methylated cytosines are calculated for 3 different sequence contexts for buffy coat (G) and placenta (H), respectively. Fractional methylated C is calculated as the proportion of the methylated cytosines at a particular sequence context over total methylated C sequenced. The results indicate that most of the methylated cytosines are from CpG dinucleotides, i.e. CGA, CGC, CGG and CGT. The H in CHG, CHH represents A, C, or T.

