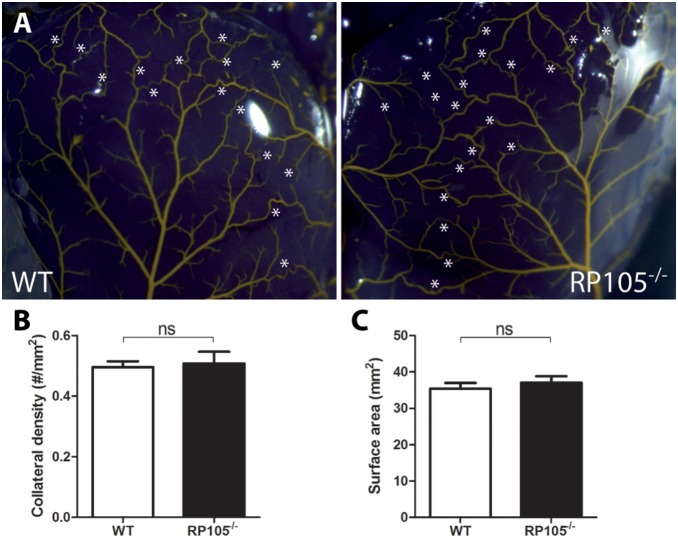
Figure 3. Pre-existing collateral bed in RP105−/− mice.
(A) Representative images of the pial circulation in WT and RP105−/− mice. White asterisks indicate collateral arteries between anterior, middle and posterior cerebral arteries (ACA, MCA and PCA, respectively). (B) Pial collateral density was calculated in WT (n = 4) and RP105−/− (n = 4) mice, dividing the sum of ACA to MCA, ACA to PCA and MCA to PCA connectors by the surface area of the cerebral hemispheres. (C) Region of the brain utilized for calculation of pial density. Areas were excluded when they were damaged, had poor filling with Microfil, or were otherwise uncountable. ns = non-significant. All values are presented as the mean ± SEM.

