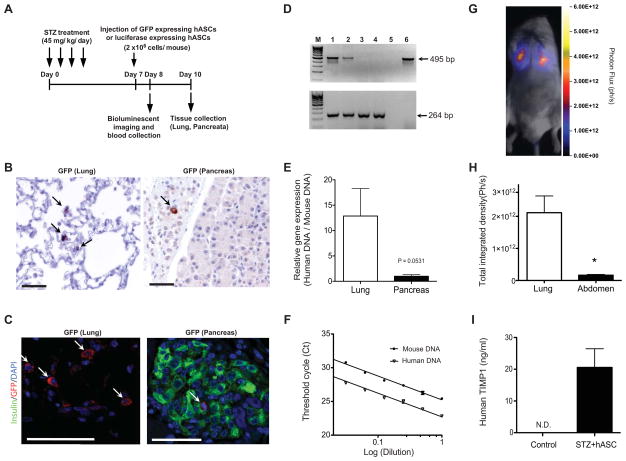
Figure 6. Systemically administered hASCs can be detected at low levels in the pancreas following STZ injection.
A: Timeline for homing analysis. STZ (45 mg/kg/day) was administered daily for 4 days, and 2 × 10⁶ GFP or luciferase expressing hASCs were injected via tail vein on day 7. Bioluminescent imaging and serum collection were performed on day 8. Tissues were collected for immunocytochemistry and immunofluorescent analysis on day 10. B–C: GFP immunocytochemistry of lung and pancreatic sections (B, 20X magnification), and immunofluorescence analysis of GFP (C, 40X magnification). Arrows indicate GFP positive cells. Scale bars = 50μm. D: Species-specific amplification of genomic DNA for hASC detection in lung and pancreata demonstrating different sizes for the human (495 bp; upper panel) and mouse (264 bp; lower panel) amplicons after 40 cycles. Lane M, marker; lane 1, lung from hASC-injected mouse; lane 2, pancreas from hASC-injected mouse; lane 3, lung from PBS-injected control mouse; lane 4, pancreas from PBS-injected control mouse; lane 5, PCR with no template (negative control); lane 6, hASCs (positive control for human gene). E: Real-time quantitative PCR for species-specific expression of genomic DNA. F: PCR efficiency curve for mouse and human primer sets. G: Bioluminescent in vivo whole-animal images were acquired from NOD/SCID mice treated with STZ+hASCs. Images were acquired one day after hASC administration. H: Quantification of total integrated density of luciferase labeled hASCs in lung and abdomen on day 8. *p<0.05 compared to lung. I: Serum TIMP-1 was measured using a human specific ELISA in STZ+hASC treated NOD/SCID mice and compared to NOD/SCID controls that did not receive hASC injection. N.D.= not detected. Results are expressed as the means ± S.E.M, n=at least 3 biological replicates for each experiment.

