
Figure 6. Quantitative RT-PCR analysis of ANGPTL2 and MT1-MMP gene expression from 3D ECFC vascular structures.
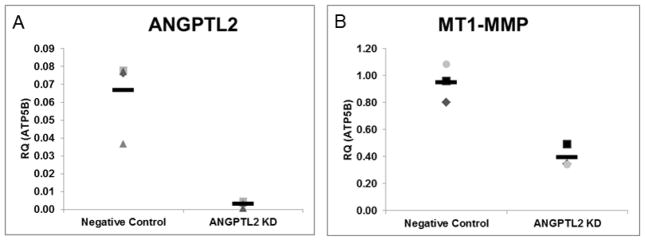
3D vascular structures formed from siRNA treated ECFCs were lysed with RNA lysis buffer at 48 hours. Real time PCR was used to determine relative expression levels of ANGPTL2 and MT1-MMP in 3D in response to ANGPTL2 KD. Both transcripts were found to be decreased in ANGPTL2 silenced ECFCs in 3D. Data are normalized to the housekeeping gene ATP5B. RQ = relative quantity; n = 3. Statistical analysis: Mann-Whitney test.