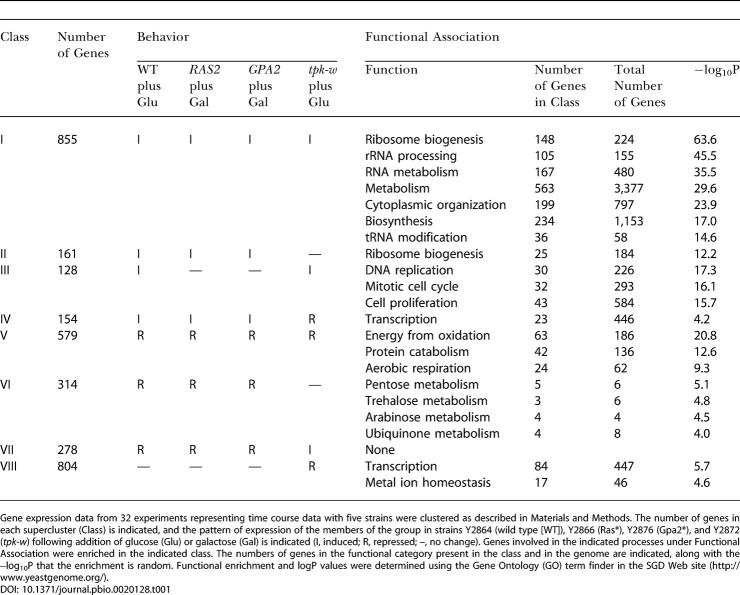
Table 1. Functional Enrichment among Genes Clustered by Response to Glucose and Ras Activation.
Gene expression data from 32 experiments representing time course data with five strains were clustered as described in Materials and Methods. The number of genes in each supercluster (Class) is indicated, and the pattern of expression of the members of the group in strains Y2864 (wild type [WT]), Y2866 (Ras*), Y2876 (Gpa2*), and Y2872 (tpk-w) following addition of glucose (Glu) or galactose (Gal) is indicated (I, induced; R, repressed; –, no change). Genes involved in the indicated processes under Functional Association were enriched in the indicated class. The numbers of genes in the functional category present in the class and in the genome are indicated, along with the −log10P that the enrichment is random. Functional enrichment and logP values were determined using the Gene Ontology (GO) term finder in the SGD Web site (http://www.yeastgenome.org/)

