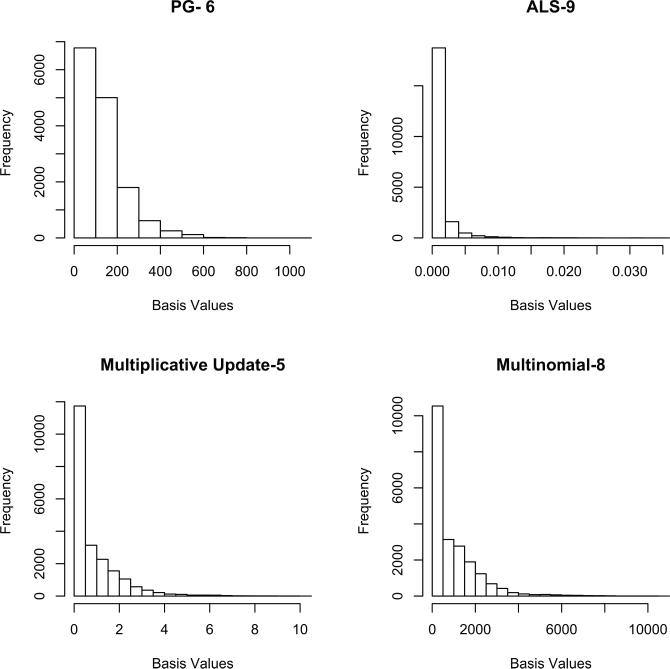
Figure 2.
Basis Values resulting from NMF factorization of Feature Matrix using four different NMF algorithms: PG (Projected Gradiant), ALS (Alternating Least Squares), Multiplicative Update, and Multinomial Estimation. The number represents the total number of encoding dimensions which were different (statistically significant) between ADHD and TD, based upon a 2-sample t-test. There were 20 total dimensions extracted using NMF.

