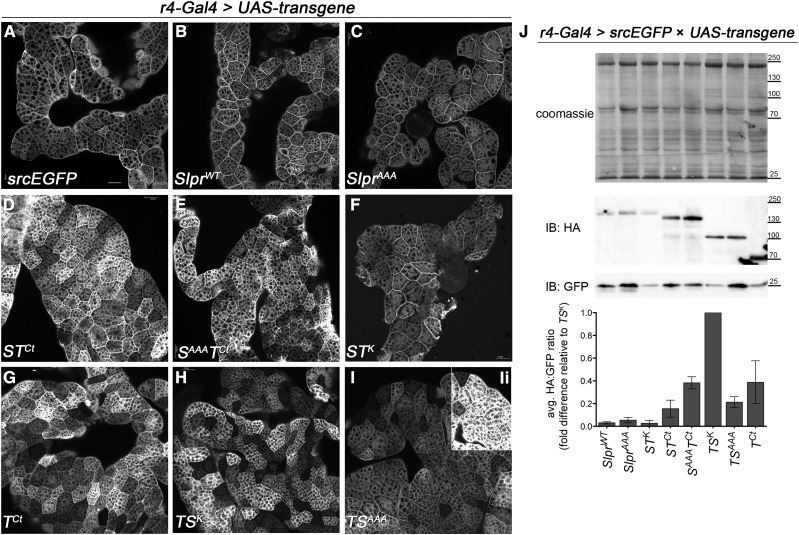
Figure 3.
Differential localization and expression of transgenic proteins in the larval fat body. (A) GFP fluorescence and (B–Ii) anti-HA immunostaining. The indicated constructs were expressed in larvae with the r4-Gal4 driver. Images are single confocal sections. (B–F, Ii) Fluorescence intensity is comparable among panels. (G–I) Images were captured at half laser power compared to panels B–F to reflect differences in expression levels or protein stability. The inset panel (Ii) shows fluorescence intensity captured with the same settings used for panels B–F. Bar, 50 μm. (J) Transgenic protein expression levels in larval lysates were determined relative to GFP. Coomassie-stained membrane shows similar loading of whole larval lysates expressing the indicated transgenes and GFP under the control of the r4-Gal4 driver. Western immunoblots (IB) with the respective antibodies reveal levels of protein expression, graphed below as the ratio of HA:GFP, averaged over three replicates and normalized to the transgene with the highest expression ratio. Bars are the means ± SEM. Molecular weight markers in kilodaltons are indicated.

