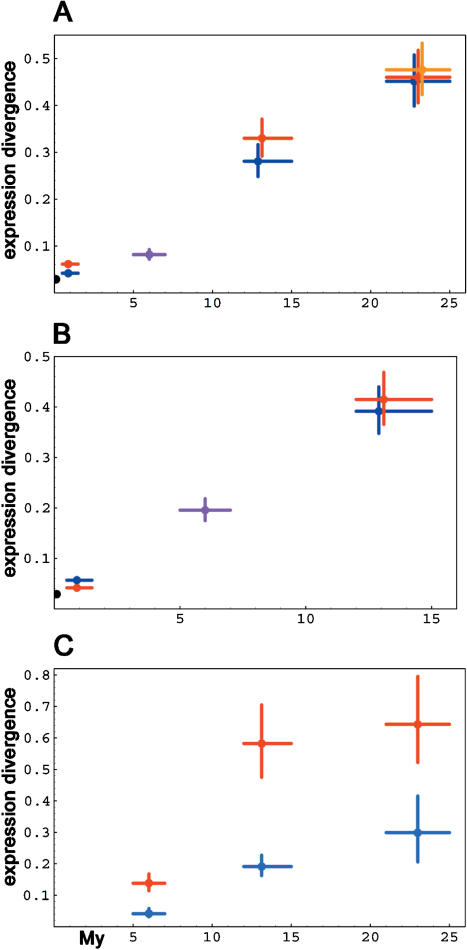
Figure 1. Brain and Liver Transcriptome Change among Primates as a Function of Time.
Average expression differences within and between primates in brains (A), in liver (B), and for genes in brain for genes with high (red) and low (blue) variation among six humans (C). Colors: red, comparisons between and with humans; blue, comparisons between and with chimpanzees; purple, comparisons between humans and chimpanzees; orange, comparisons between orangutan and rhesus macaque; black, comparisons between experimental duplicates. Vertical error bars for expression indicate 95% confidence intervals calculated by 10,000 bootstraps over genes. Divergence times are according to Glazko and Nei (2003).

