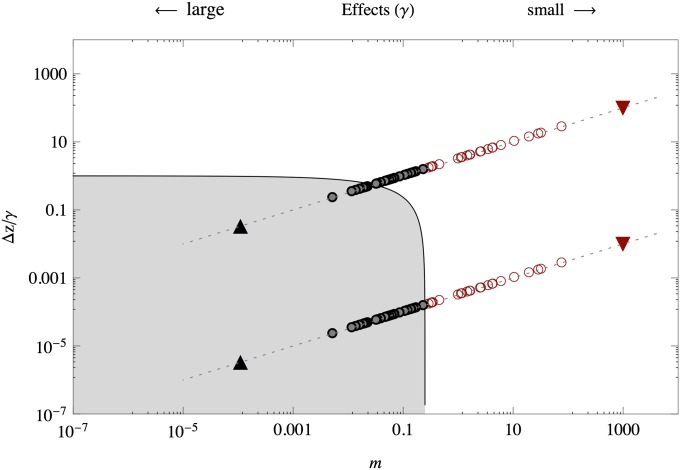
Figure 3.
Diagram showing the two regions of qualitatively different equilibria of allele frequencies. For m < 1/4 (the gray region) the allele frequencies are near fixation points. When m > 1/4, only polymorphisms can be maintained. On a log scale the effects are distributed along parallel lines whose height is determined by log(Δz) − log(γ) and log(μ/S) − 2log(γ) and therefore have a slope of 1/2. Effects that fall at the right-hand side of the point m = 1/4 can never fall into the bistable regime and correspond to the alleles with the smallest effect. Depicted are (circles) effects distributed, γ ∼ exp(10); (upward triangles) traits with equal but large effects (γ = 3); and (downward triangles) traits with equal but small effects (γ = 0.001).

