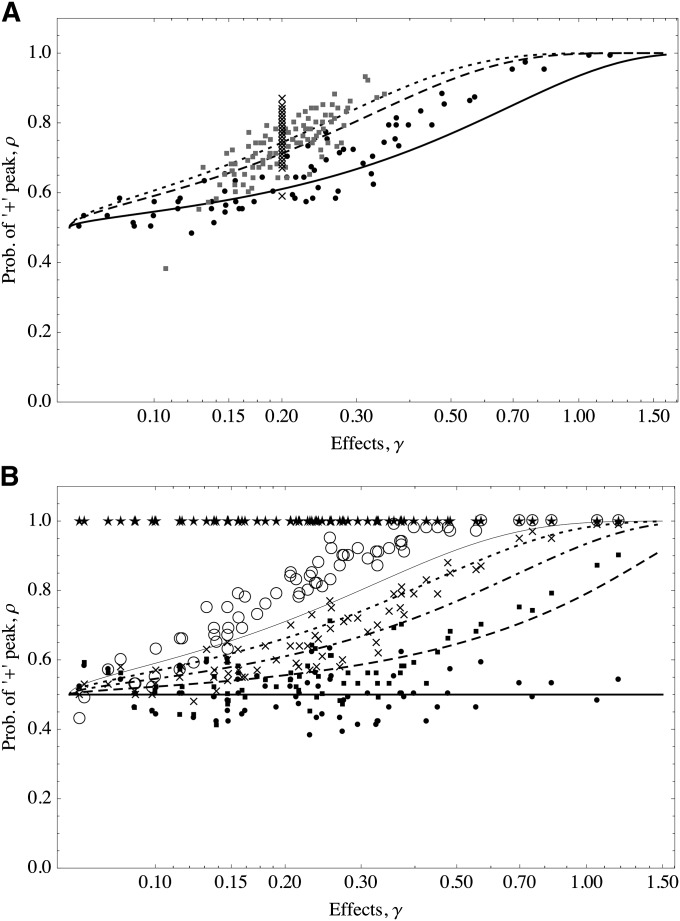
Figure 4.
The probability of + alleles increases as the magnitude of their effect gets larger. Lines follow Equation 11; symbols show average of occurrences of the + state from 100 simulations. (A) The optimum is fixed and the distribution of allelic effects is varied. zo = 10 (roughly halfway from the maximum trait value). Solid line and solid circles show exponential distribution (mean = 1/5); dashed line and shaded squares show gamma distribution (shape = 20, scale = 1/100); dotted line and crosses show equal effects, γ = 1/5. (B) The distribution of allelic effects is fixed and the position of the optimum is varied. Effects are distributed as an exponential (mean = 1/5); thick solid line and solid circles show zo = 0, dashed line and solid squares show zo = 5, dotted-dashed line and crosses show zo = 10, dotted line and open circles show zo = 15, and thin solid line and stars show zo = 20. In all cases the trait is determined by 100 loci. μ = 10−4, S = 0.1. The initial conditions were uniformly and independently drawn for each locus.

