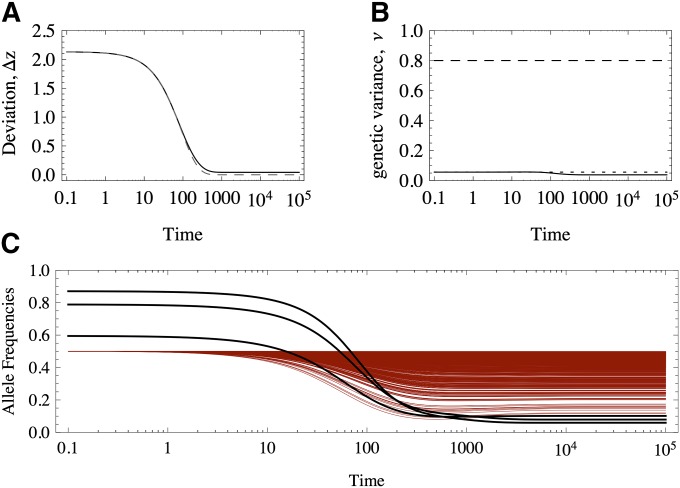
Figure 9.
Response to an abrupt displacement of the optimum of a polygenic trait constituted mainly by alleles of small effect. (A) Deviation of the trait mean from the newly positioned optimum. Solid black line, exact numerical results; dashed gray line, approximation assuming an effective number of loci, neff = 28 and constant genetic variance, ν ≃ 2neμ/S (see text). (B) Genetic variance. Solid black line, exact numerical results; dashed black line, house of cards prediction, (ν = 2nμ/S); dotted black line, exact value from Equation 12. (C) Response of the allele frequencies: black lines, alleles of large effect; thin red lines, alleles of small effect. The trait has n = 400 loci, 3 of large effects and 378 of small effects, distributed as an exponential of mean = 1/80. μ = 10−4, S = 10−1, zo ≃ −2.

