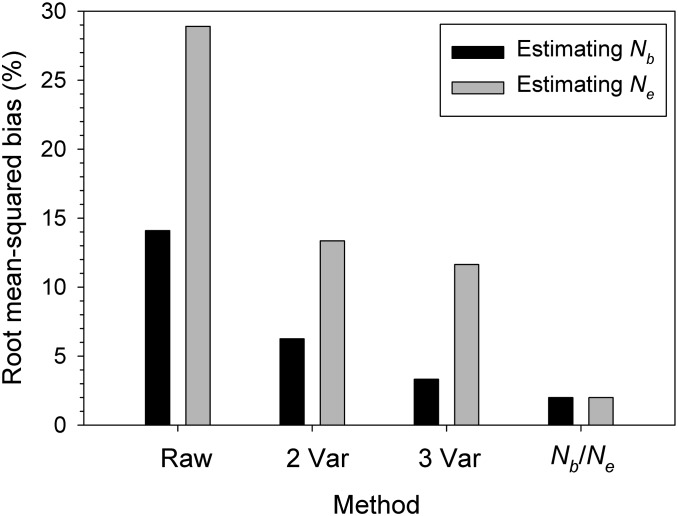
Figure 4.
Percent root mean-squared bias in and and how it changes when raw estimates are adjusted per formulas in Table 3, using true Nb/Ne or information for two or three life history traits. Results apply to samples from single cohorts and are averaged across the 21 model species.

