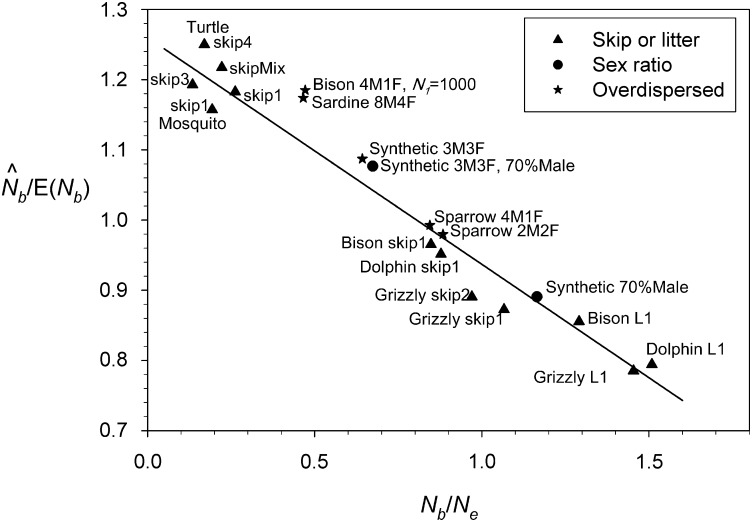
Figure 7.
Pattern of bias in estimates of Nb for single-cohort samples from simulated populations under life history variations that deviate from the standard model. Solid triangles, maximum litter size is 1 (L1) or females are forced to skip up to four breeding cycles after reproducing; solid circles, skewed (70% male) primary sex ratio; stars, overdispersed variance among same-age, same-sex individuals. For example, “sardine 8M4F” denotes results for simulations using the sardine life table with Vk for males of each age being eight times the mean and Vk for females of each age being four times the mean. The solid line is the regression of with Nb/Ne under the standard model (from Figure 2B). Data for life history variants for the model species are taken from Table S2.

