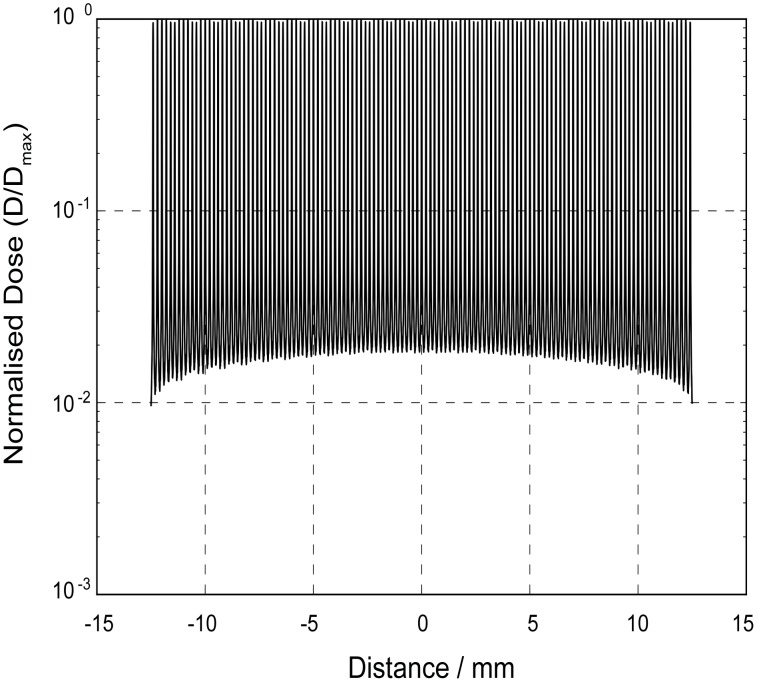
Figure 1. The different dose components of the MRT beam.
MRT ‘peak’ & ‘valley’doses, This profile was generated from our GEANT4 Monte Carlo computer simulations of the dose distribution for a 25×25 mm array of 25/175 µm microbeams at a depth of 2 mm in a water phantom. The Supporting Information section contains more detailed information on the simulations.

