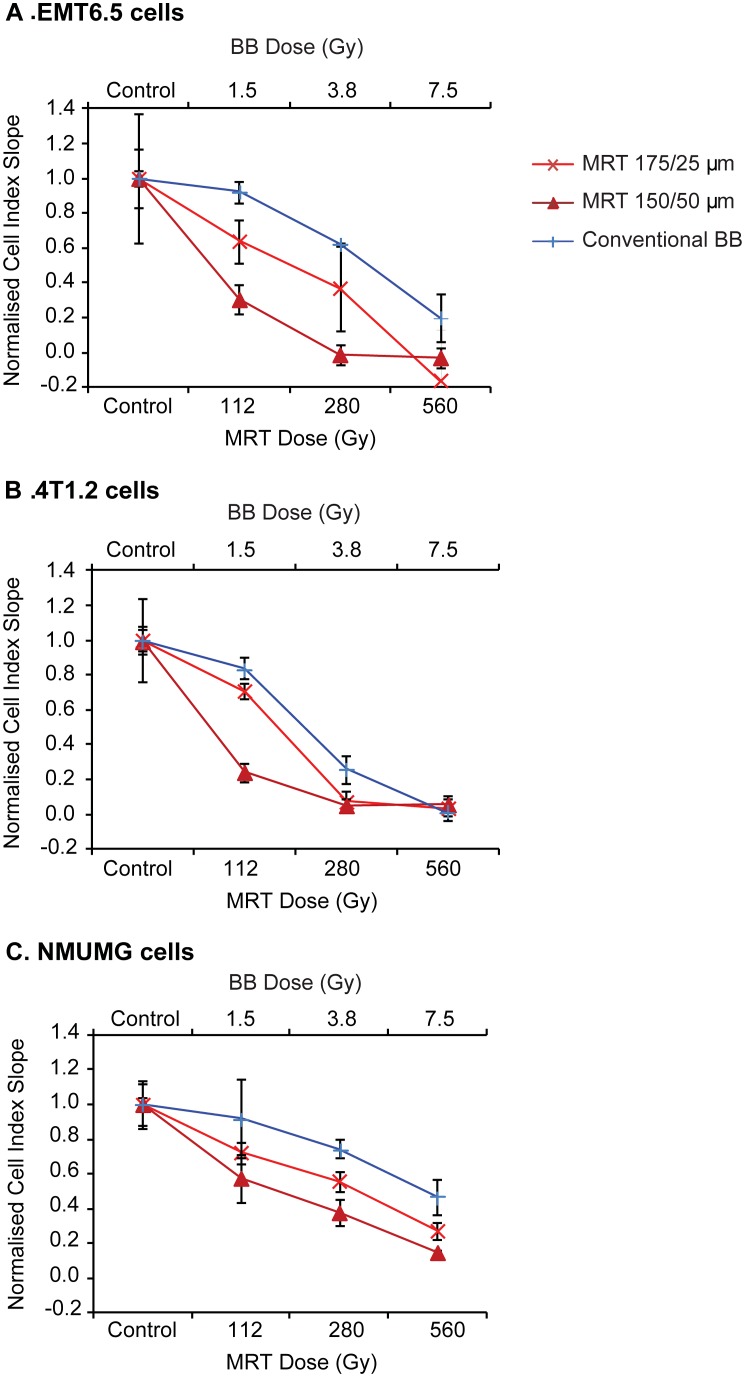
Figure 3. Comparison of cell proliferation response by xCELLigence assays following BB and MRT irradiations.
(A) EMT6.5 tumour, (B) 4T1.2 tumour and (C) NMuMG normal mouse mammary epithelial cells following synchrotron BB or MRT 175/25 µm and MRT 150/50 µm irradiation. BB doses were similar to the MRT valley dose determined by Monte Carlo modelling. For all cell lines, the reduction in cell index for 150/50 µm>175/25 µm>BB. Data are represented as mean ± SEM (n = 3).

