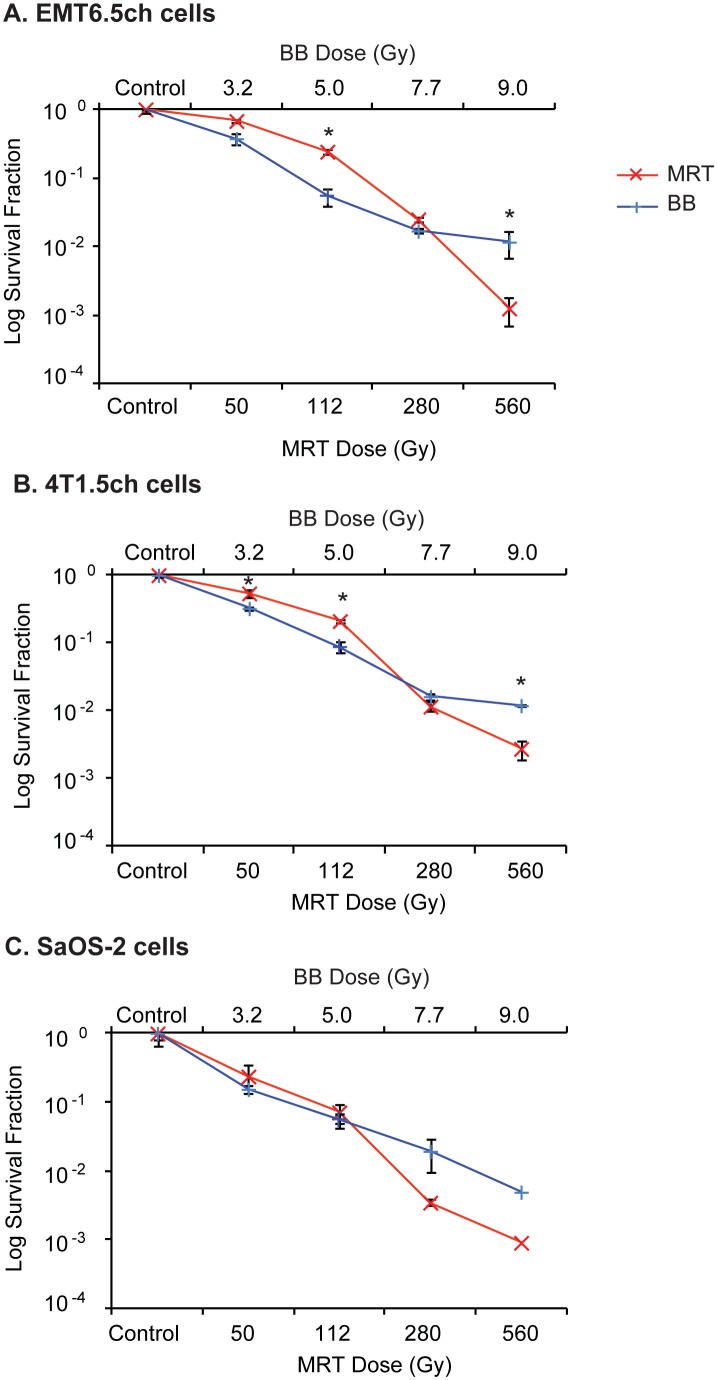
Figure 4. Testing for dose equivalence between BB and MRT by clonogenic assays.
Comparison of clonogenic survival of (A) EMT6.5ch tumour, (B) 4T1Ch5 tumour and (C) SaOS-2 tumour cells following MRT 175/25 or synchrotron BB at equivalent doses. Data are represented as mean ± SEM for EMT6.5ch (n = 3), 4T1Ch5 (n = 3) and SaOS-2 (n = 2); *p<0.05. EMT6.5ch – mouse mammary tumour cells, 4T1Ch5– mouse mammary tumour cells, SaOS-2– osteocarcinoma cells.

