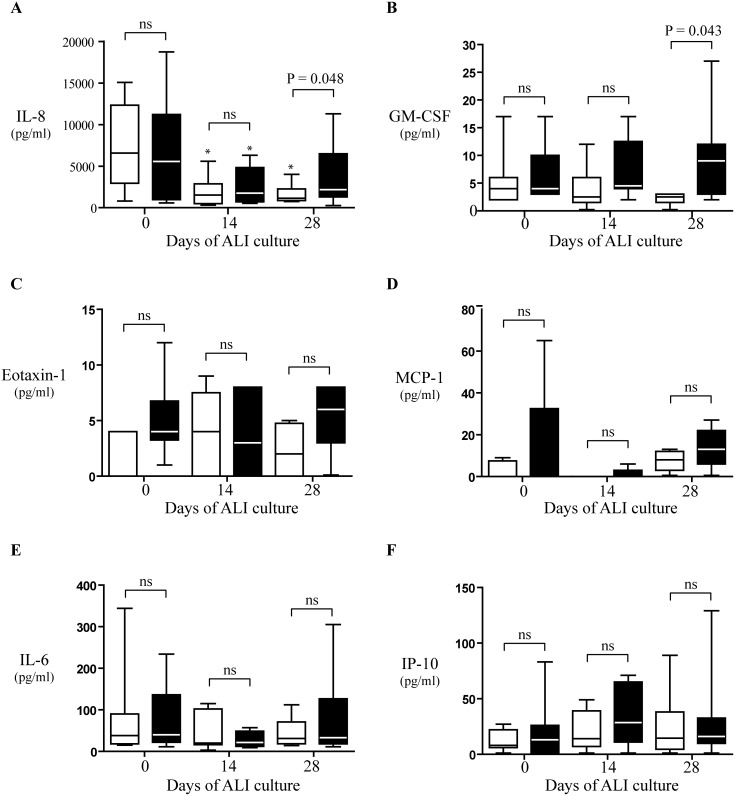
Figure 6. Cytokine and chemokine apical secretion from both nasal polyp (black boxes) and control nasal mucosa (white boxes) ALI cultures at different days.
A, interleukin-8 (IL-8), B, granulocyte-macrophage colony-stimulating factor (GM-CSF), C, eotaxin 1, D, monocyte chemoattractant protein-1 (MCP-1), E, interleukin-6 (IL-6), and F, interferon-γ–induced protein-10 (IP-10), levels in apical washes. Results are expressed as medians and interquartile ranges with 25th and 75th percentiles. ns, P>0.05 vs day 0 (100%); *, P<0.05 vs day 0. Statistical analysis by Mann-Whitney U test (between groups) and by Wilcoxon test (within groups).

