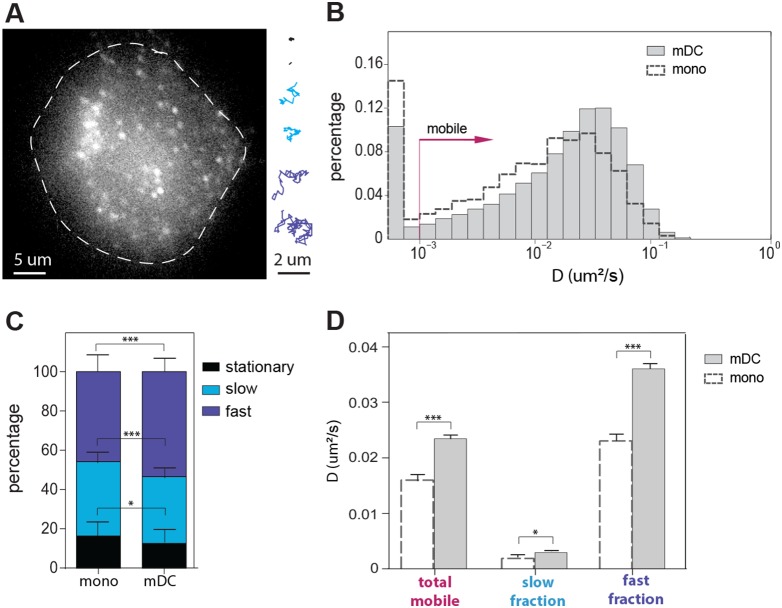
Figure 1. Mobility of LFA-1 on monocytes and mDCs.
(A) Representative frame from a recorded movie on a mDC to which SDT was applied (see Movie S1). Representative examples of stationary, slow and fast trajectories are displayed. (B) Overlay semi-log histogram of LFA-1 diffusion on both monocytes (dashed black lines) and mDCs (grey bars). (C) Percentage of stationary, slow and fast diffusing LFA-1 molecules on monocytes and mDCs, as extracted from the cumulative probability distribution analysis (see Methods). (D) Diffusion coefficient of the total mobile population, and slow and fast diffusing fractions of LFA-1 on monocytes and mDCs. 25 monocytes divided over 6 independent samples (4587 trajectories) and 117 mDCs from 5 different donors, divided over 117 independent samples (26756 trajectories) were imaged. Means ± SEM are depicted. The Student T-test was used to determine significant differences between means. The resulting P values are indicated as follows: *P<0.05; ***P<0.0001.

