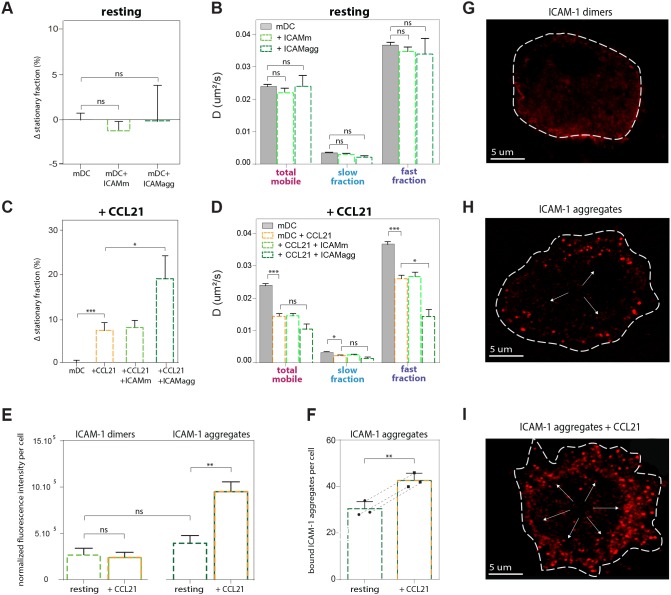
Figure 3. Mobility of LFA-1 on resting and CCL21-activated mDCs after soluble monomeric and nano-clustered ICAM-1.
(A,B) ICAM-1 (either monomeric: ICAMm, or as nano-aggregates: ICAMagg) was added to resting mDCs and mobility was measured before, and between 1 and 5 min after addition. (A) Stationary fraction of LFA-1 molecules on resting mDCs and mDCs + either monomeric ICAM-1 or ICAM-1 nano-aggregates, displayed as the difference with respect to the total stationary fraction on resting mDCs, which serve here as the default. (B) Diffusion coefficient of the total mobile population, and slow and fast diffusing fractions of LFA-1 on resting mDCs and after addition of either monomeric ICAM-1 or ICAM-1 nano-aggregates. 30 cells divided over 2 independent experiments (3393 trajectories) were imaged for the ICAMm condition and 10 cells (684 trajectories) for ICAMagg. (C, D) ICAM-1 (either monomeric or nano-aggregates) was added together with CCL21 to mDCs and mobility was measured before, and 2 minutes after addition. (C) Stationary fraction of LFA-1 molecules on resting mDCs (serving as reference control), CCL21 activated mDCs and CCL21 activated mDCs + either monomeric ICAM-1 or ICAM-1 nano-aggregates, displayed as the difference with respect to the total stationary fraction on resting mDCs. (D) Diffusion coefficient of the total mobile population, and slow and fast diffusing fractions of LFA-1 on resting mDCs, CCL21 activated mDCs and after simultaneous addition of CCL21 and either monomeric ICAM-1 or ICAM-1 nano-aggregates. 16 cells (8423 trajectories) from 2 different donors divided over 5 independent samples (ICAMm) and 7 cells (314 trajectories) from 2 different donors divided over 7 independent samples (ICAMagg) were imaged. (E) Quantification of fluorescent ICAM-1 dimers (monomers bound together due to antibody labelling) and nano-aggregates binding in resting and CCL21 activated mDCs, normalized to the area quantified and to the background signal outside of the cell. For this, regions of the cell in between the obvious fluorescent ICAM-1 aggregates were selected, the fluorescent intensity was measured using ImageJ, and used to compare the baseline fluorescent signal across all 4 conditions. 20 cells per condition were imaged. (A–E) Means ± SEM are depicted. The One-way ANOVA followed by the Tukey multiple comparison test were used to determine significant differences between means. The resulting P values are indicated as follows: ns (P>0.05); * (P<0.05), ** (P<0.001) and *** (P<0.0001). (F) Quantification of bound ICAM-1 nano-aggregates to resting and CCL21 activated mDCs. After applying a threshold of 25% of the fluorescent signal, all visible fluorescent spots per cell were counted. 20 cells per donor and 3 different donors were imaged. Each data point represents the mean value for 1 donor. Means ± SEM and individual data points are depicted, and dotted lines connecting datapoint of the same experiment indicate that not just in average, but in each individual experiment using a different donor, an increase of ICAM-1 nano-aggregate binding is observed after CCL21 activation. The paired two-tailed Student T-test was used to determine significant differences between means. (G–I) Representative examples of confocal images of ICAM-1 binding to mDCs: (G) dimeric ICAM-1 to resting cells, (H) nano-aggregates of ICAM-1 to resting cells and (I) nano-aggregates to CCL21 activated cells. Arrows in H and I point to the binding of individual ICAM-1 nano-aggregates to LFA-1.

