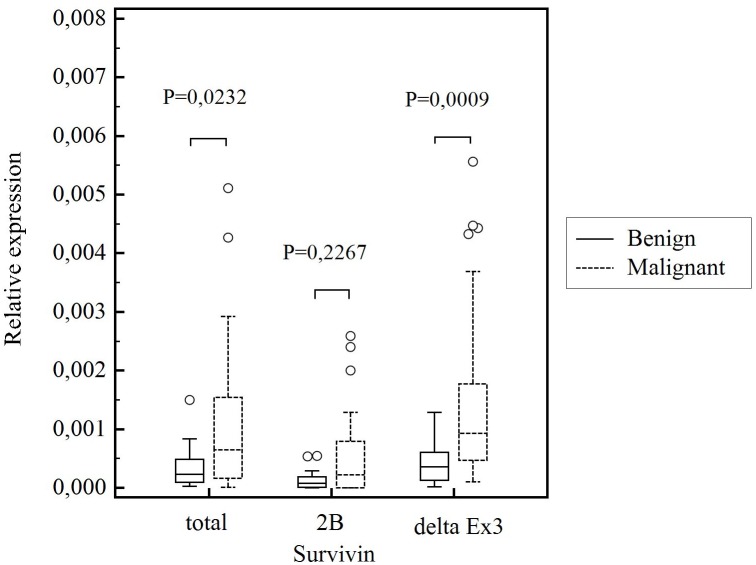
Figure 1. Comparison of relative survivin gene expression, survivin 2B expression and survivin delta Ex3 expression in benign and malignant thyroid nodules.
Central box represents the values from the lower to upper quartile (25th to 75th percentile). The middle line represents the median. The thin vertical lines extending up or down from the boxes to horizontal lines (so-called whiskers) extend to a multiple of 1,5× the distance of the upper and lower quartile, respectively. Outliers are any values beyond the whiskers.

