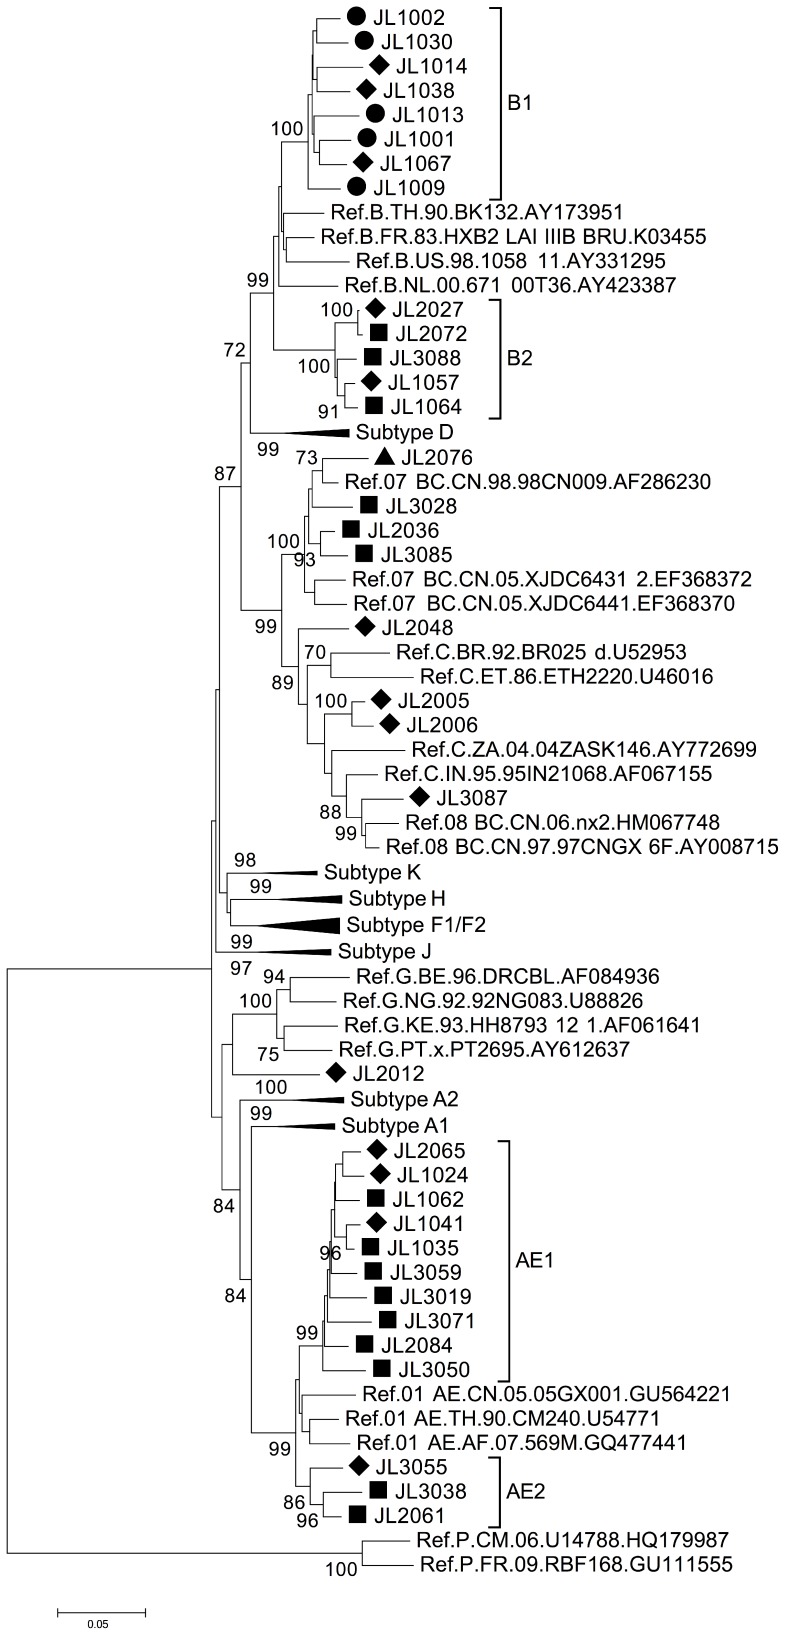
Figure 1. Phylogenetic analysis of gag/pol region (HXB2 1831–3025) of HIV-1 samples from Jilin province.
The tree was constructed with MEGA5, using the Kimura-2 parameter model and the bootstrap method with 1,000 replicates. Only values above 70% are shown. Symbols indicate transmission through heterosexual activity (♦), homosexual activity (▪), blood donation (•) or IDU (▴).

