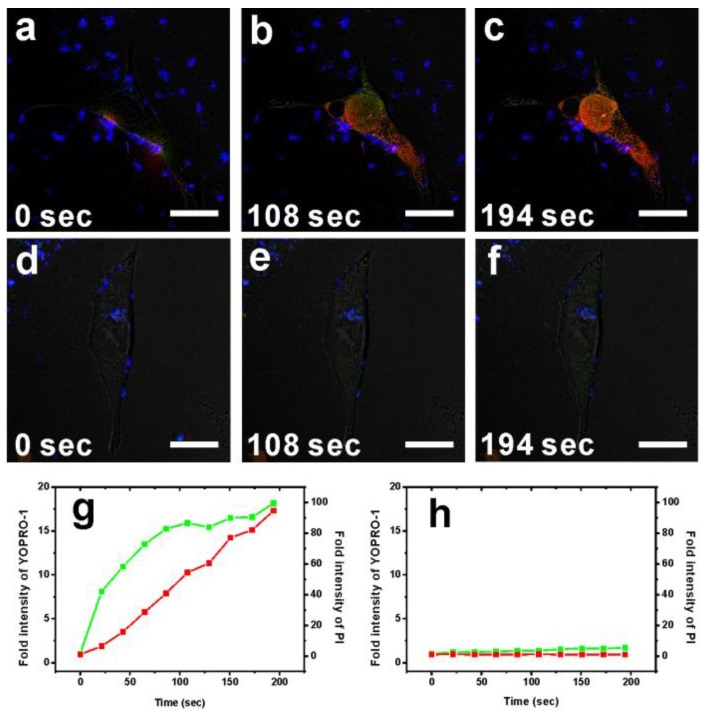
Figure 4.
Confocal fluorescence microscopy images showing the TPA-PDT performance (1O2 cytotoxicity) of MS-GNR-PdTPPs (a)-(c) and MS-GNRs (d)-(f) in treated breast cancer cells under 3 mW repetitive laser irradiation of 3 durations: 0, 108, and 194 seconds. YOPRO-1 (green) and propidium iodide signals (red) denote leakage of the cell and nuclear membranes, respectively. Scale bar: 10 µm. Fluorescence intensity of YOPRO-1 and propidium iodide as a function of irradiation period for cells treated with MS-GNR-PdTPPs (g) and MS-GNRs (h).

