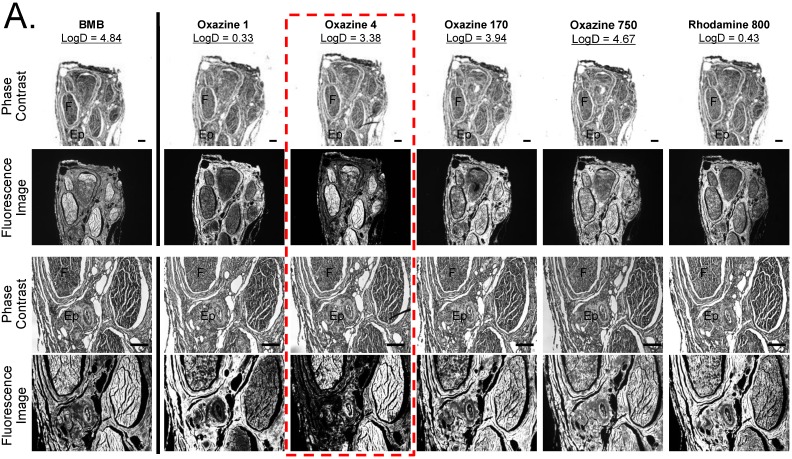
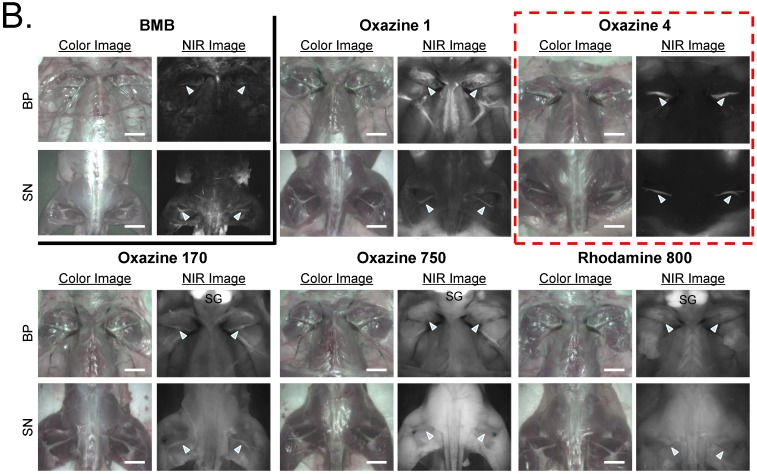
Figure 2.
Ex Vivo and In Vivo Screening Assay of Fluorophores for Nerve-Specificity. A) Nerve-specific fluorescence intensity was determined using staining of human sural nerve cut in cross section and incubated with 100 µM of each fluorophore. Ep = epineurium; F = nerve fascicle. Scale bars = 200 µm. The partition coefficient (logD at pH 7.4) was calculated using JChem calculator plugins. B) In vivo nerve-specific fluorescence in the rat brachial plexus (BP, top rows) and sciatic nerve (SN, bottom rows) 4 h post-injection. Arrowheads indicate fluorescence signals in nerve tissue. SG = salivary gland. Scale bars = 1 cm. All NIR fluorescence images have identical exposure and normalizations.


