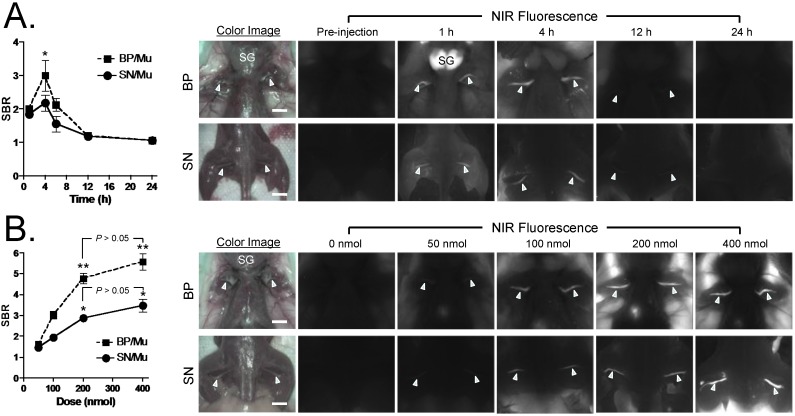
Figure 3.
Kinetics and Dose-Response of Oxazine 4 Uptake in Mice. A) Quantitative time-course assessment of SBR (mean ± SEM) for brachial plexus (BP) and sciatic nerves (SN). 100 nmol (1.6 mg/kg) of Oxazine was injected intravenously into CD-1 mice, and SBR (BP/Mu) and SBR (SN/Mu) were measured at different time points (T = 0, 1, 4, 6, 12, and 24 h). Arrowheads indicate fluorescence signals in nerve bundles. SG = salivary glands; Mu = muscle. B) Dose-response curve of SBR (mean ± SEM) for BP and SN. 0, 50, 100, 200, and 400 nmol of Oxazine 4 were injected intravenously into CD-1 mice, and SBR (BP/Mu) and SBR (SN/Mu) were measured at 4 h post-injection. Arrowheads indicate fluorescence signals in nerve bundles. Images are representative of N = 5 independent experiments. **P < 0.01 and *P < 0.05. SG = salivary glands; Mu = muscle. Scale bars = 1 cm. All NIR fluorescence images have identical exposure times (500 msec) and normalizations.

