Fig. 7.
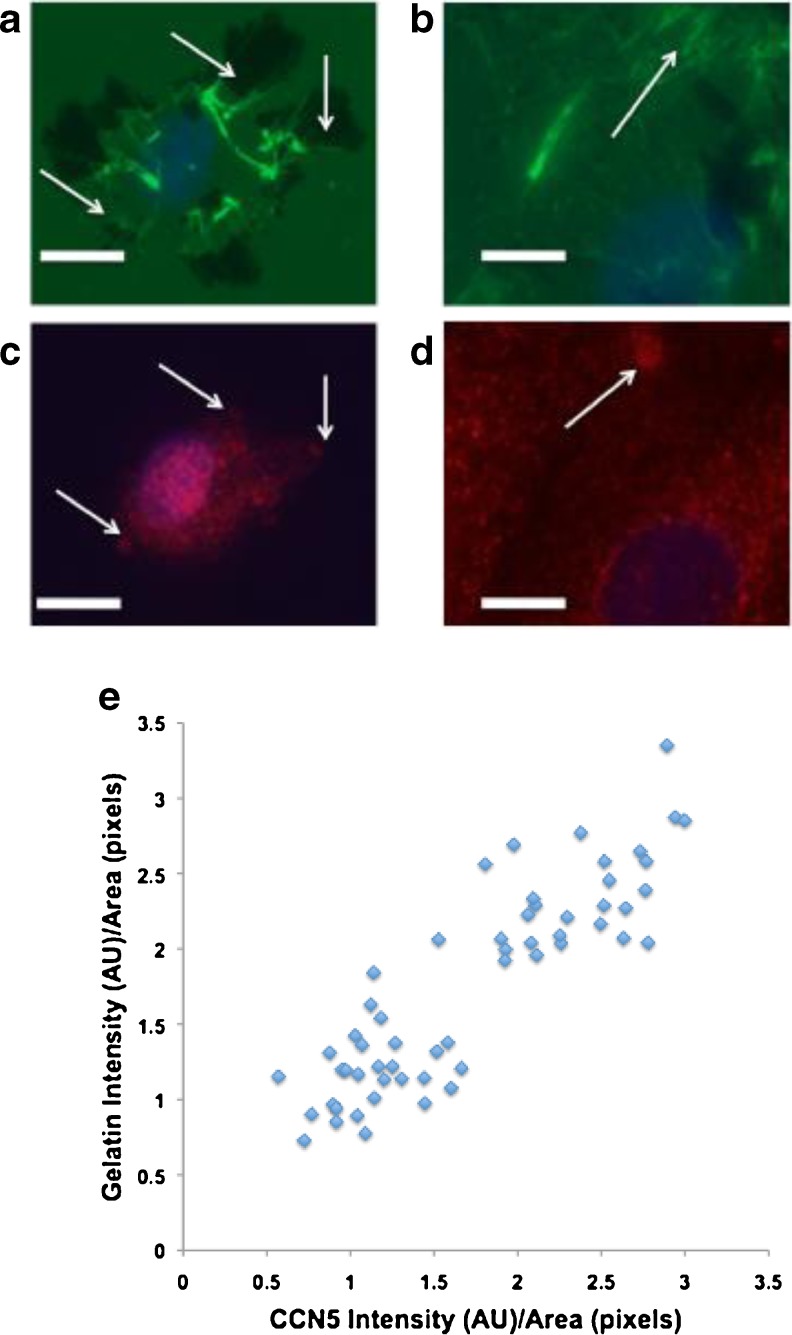
CCN5 level in a podosome correlates with decreased the ability of podosomes to degrade matrix. VSMCs were plated on glass coverslips coated with cross-linked fluorescein–conjugated gelatin. After 24 h, cells were treated with 2 μM phorbol ester phorbol 12,13-dibutyrate (PDBU) for 1 h to induce podosome formation. Cells were then fixed and stained for CCN5 and DAPI. a–b Images of gelatin (green) and DAPI (blue). c-d Superimposed images of the same fields in a-b corresponding to CCN5 (red) and DAPI (blue). Bars = 10 μm e CCN5 signal intesity/area of podosome and gelatin signal intesity/area of below corresponding podosome was quantitated using Adobe Photoshop CS. This data was then graphed in a scatterplot. n = 57. Spearman rank-order correlation coefficient (r s) = 0.828

