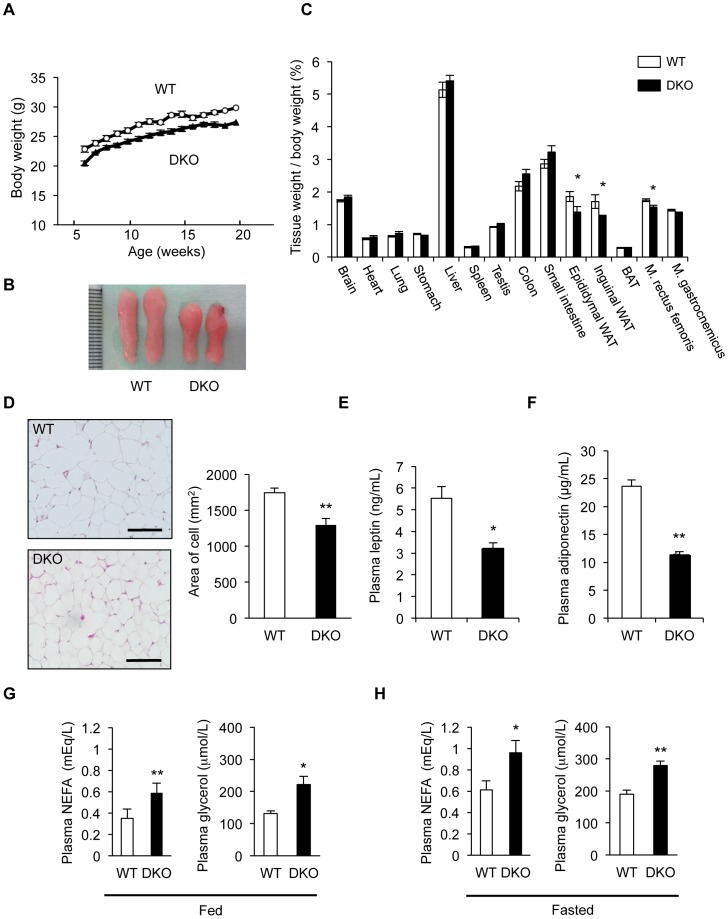
Figure 1. Impairment of fat metabolism in PRIP-DKO mice.
(A) Body weight changes in WT (open circle) and PRIP-DKO (DKO, closed triangle) male mice monitored 20 weeks after birth (n = 5 mice for both genotypes). (B) Comparison of the epididymal fat pad of WT and PRIP-DKO mice at the age of 10-week-old. (C) Comparison of wet tissue weight (representing major organs) obtained from WT and PRIP-DKO male mice at the age of 18-week-old. The graph shows percent of tissue weight against body weight [26.6±0.8 g (WT), 23.4±0.6 g (PRIP-DKO); n = 5 mice per genotype]. WAT, white adipose tissue; BAT, brown adipose tissue; M. (Musculus) rectus femoris; M. (Musculus) gastrocnemius. (D) Comparison of adipocyte size. Graph shows average size of cells assessed using hematoxylin and eosin-stained sections (n = 3 sections for both genotypes). Scale bar: 100 µm. (E, F) Concentration of plasma leptin (n = 5 mice for both genotypes) and adiponectin (n = 7 mice for both genotypes) at the age of 10–12 weeks. Mice were fed a standard chow ad libitum. (G, H) Plasma NEFA and glycerol concentration at the age of 10–12 weeks under conditions of (G) ad libitum feeding (n = 3 mice for both genotypes) and (H) fasting for 8 h (n = 4 mice for both genotypes). The data represent mean ±SEM. *P<0.05 and **P<0.01 versus the corresponding WT value.

