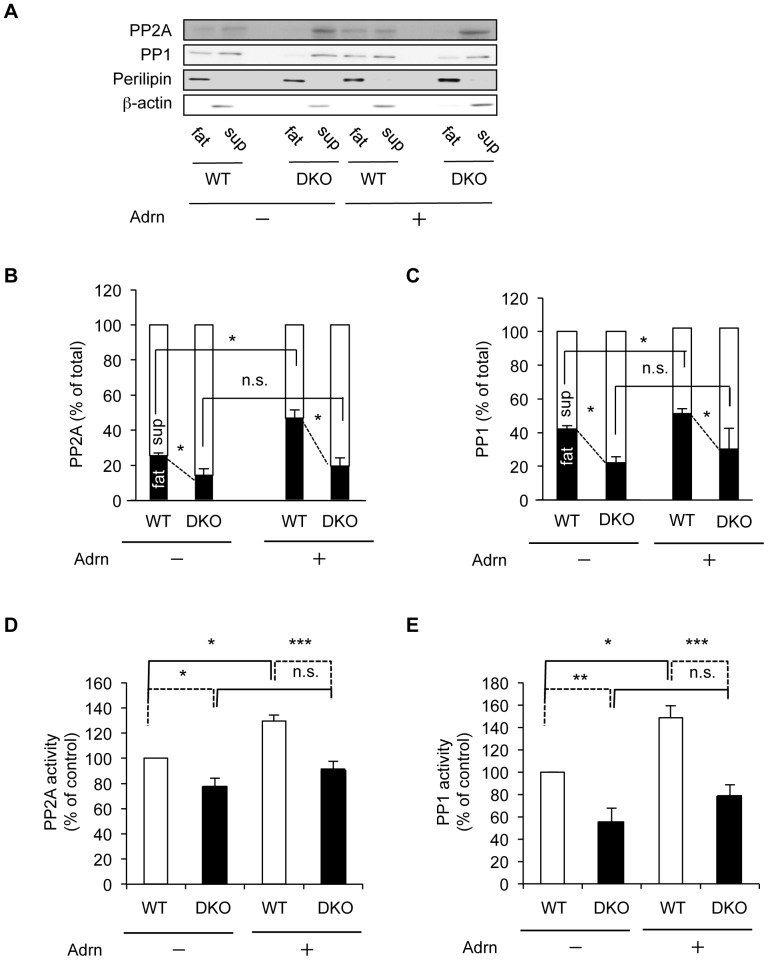
Figure 4. PP2A and PP1 are translocated from the cytosol to lipid droplets in adipocytes in response to adrenaline stimulation.
(A–C) Translocation of PP2A (A, B) and PP1 (A, C) to the lipid droplet fraction in response to stimulation with 1 µM adrenaline (Adrn). The bar graph shows the amount of PP2A (B) and PP1 (C) in fat (black) and sup (white) fractions, respectively. A typical image from four independent experiments is shown (A). (D, E) Phosphatase activity in floating fat-cake fraction. Phosphatase activities of PP2A (D, n = 4) and PP1 (E, n = 5) were measured using floating fat-cake fractions from WT and PRIP-DKO explants treated with or without 1 µM adrenaline. The data represent mean ±SEM; *P<0.05, **P<0.01, ***P<0.001 and n.s. (not significant) versus the corresponding values for paired bars connected by solid and dotted lines (B–E).

